FIG 5.
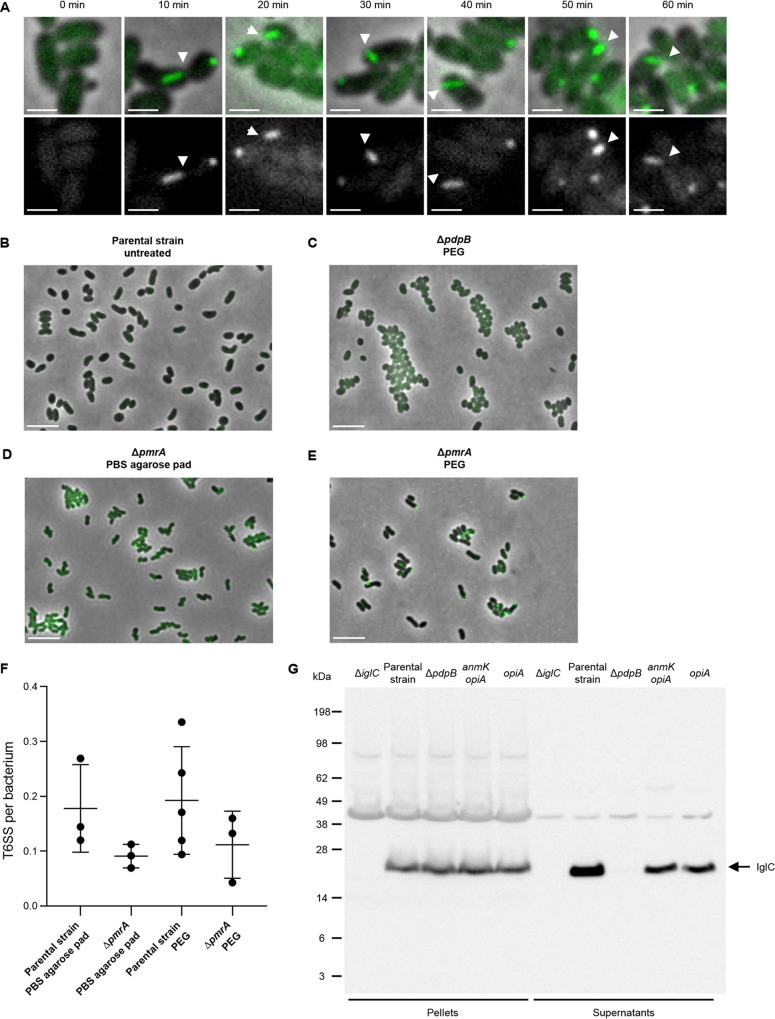
PEG activates Francisella T6SS in liquid culture. (A) Examples of assembled T6SS (IglA-sfGFP) in F. tularensis subsp. novicida U112 iglA-sfGFP (parental strain) during PEG treatment. Filled arrows point to examples of assembled T6SS. Upper images are a merge of phase contrast and GFP channel. The lower images show GFP channel only. The 3.3- by 3.3-μm fields of views are shown. Scale bars represent 1 μm. (B) No T6SS assemblies (IglA-sfGFP) were observed in untreated F. tularensis subsp. novicida U112 iglA-sfGFP (parental strain) and in the ΔpdpB mutant (T6SS-negative control) (C) after PEG treatment for 60 min. (D) T6SS activation in F. tularensis subsp. novicida U112 iglA-sfGFP ΔpmrA mutant on PBS agarose pad after 60 min incubation. (E) T6SS assemblies in F. tularensis subsp. novicida U112 iglA-sfGFP ΔpmrA mutant after PEG treatment for 60 min. (B to E) Merge of phase contrast and GFP channel and 39- by 26-μm fields of view are shown. Scale bars represent 5 μm. (F) Quantification of T6SS sheaths per bacterium within 5 min. At least three biological replicates with at least 750 bacteria each were analyzed per strain and condition. Mean with standard deviation is shown. No significant differences in means were detected with Tukey’s multiple-comparison test and 95% confidence level. (G) Levels of inner tube protein IglC was assessed in bacterial pellets and concentrated supernatants of F. tularensis subsp. novicida U112 iglA-sfGFP (parental strain), ΔiglC mutant (negative control for α-IglC antibody), ΔpdpB mutant (T6SS-negative control), ΔpdpC ΔpdpD ΔopiB1–3 mutant (anmK opiA), and ΔpdpC ΔpdpD ΔanmK ΔopiB1–3 mutant (opiA) after PEG treatment for 1 h. Arrow points to IglC bands (theoretical size, 22.1 kDa). An exposure time of 1 min was used for developing the immunoblot.

