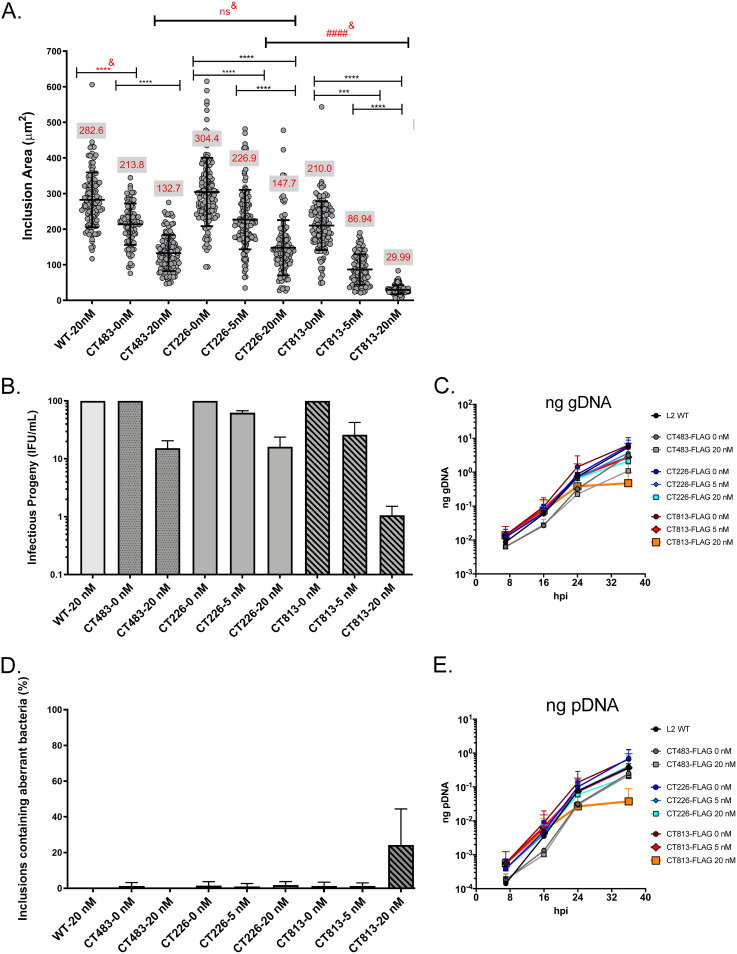
FIG 1.
Overexpression of CT813-FLAG from C. trachomatis L2 negatively impacts inclusion growth and progeny production. (A) HeLa cells seeded on coverslips were infected with C. trachomatis L2 CT813-FLAG, CT226-FLAG, or CT483-FLAG transformed strains or wild-type L2 and induced at 7 hpi with 5 or 20 nM aTc or not induced. Coverslips were methanol fixed at 36 hpi and stained for immunofluorescence to determine the inclusion area. The inclusion areas (μm2) with standard deviations were plotted and analyzed for statistical significance by an ordinary one-way ANOVA with Tukey’s multiple-comparison test using GraphPad Prism 8.4.0. These data are combined from three biological replicates. ####& indicates a significant difference between C. trachomatis L2 transformed strains induced with 20 nM aTc. ****&, P < 0.0001; ***, P = 0.0004; all P values reflect comparison to the control (wild-type and uninduced strains); ns, not significant. The red values in the gray box in panel A are the average inclusion area for each C. trachomatis L2 transformed strain. (B) Duplicate wells of HeLa cells were infected as described for panel A. At 36 hpi, infected monolayers were lysed, serially diluted, and infected onto a fresh monolayer of HeLa cells (i.e., secondary infection) in medium containing penicillin to enumerate infectious progeny (inclusion-forming units [IFU]/ml). Infectious progeny (IFU/ml) (normalized to uninduced strains and expressed as a percentage of uninduced from three biological replicates and standard deviation) were plotted and statistically analyzed (ordinary one-way ANOVA with Tukey’s multiple-comparison test using GraphPad Prism 8.4.0). Only inclusions containing normal (not aberrant) bacteria were enumerated. (C and E) HeLa cells were infected with C. trachomatis L2 CT813-FLAG, CT226-FLAG, or CT483-FLAG transformed strains, or wild-type C. trachomatis L2, and either not induced or induced at 7 hpi (5 nM or 20 nM aTc). DNA collected from separate wells of a 6-well plate at 7, 16, 24, and 36 hpi was processed as described in Materials and Methods. The genomic DNA (gDNA; ng) (C) and plasmid DNA (pDNA; ng) (E) data sets from three biological replicates were plotted using GraphPad Prism 8.4.0. The data are representative of three independent experiments. (D) Plasmid loss was indicated by inclusions containing aberrant bacteria in medium containing penicillin (i.e., sensitivity due to the loss of the plasmid-borne bla resistance gene). To enumerate the percentage of inclusions containing aberrant bacteria, the number of inclusions with aberrant bacteria was divided by the total number of inclusions counted (B) from three biological replicates and the standard deviation was plotted and statistically analyzed as described for panels A and B using GraphPad Prism 8.4.0. Differences were not statistically significant.

