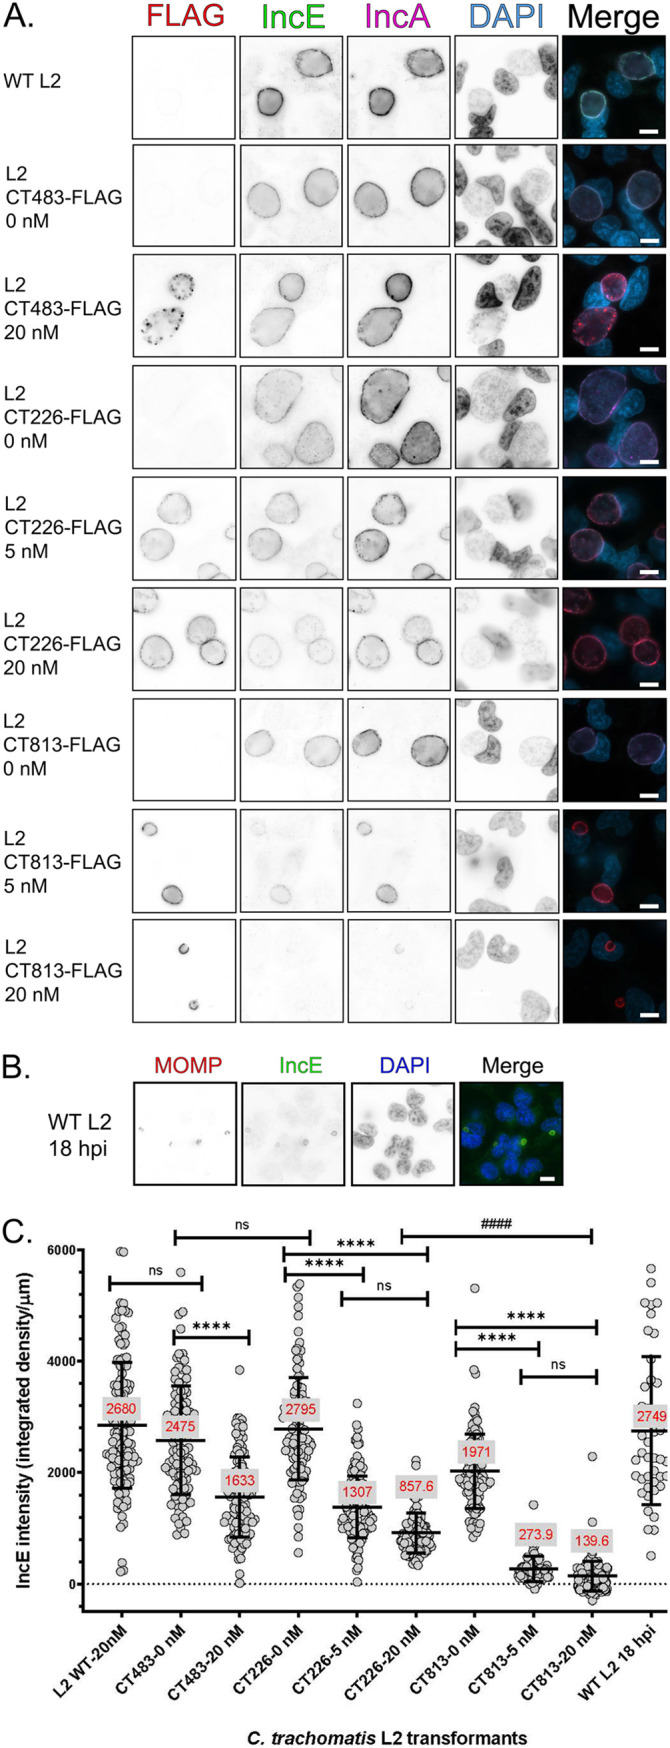
FIG 3.

The overexpression of CT813-FLAG from C. trachomatis L2 results in loss of detectable endogenous IncE in the inclusion membrane. (A) HeLa cells infected with C. trachomatis L2 transformed strains or wild-type L2 were induced with 5 or 20 nM aTc or not induced at 7 hpi. Coverslips were methanol fixed at 36 hpi and stained for immunofluorescence to observe expression of the constructs (FLAG; red), IncE (green), IncA (pink), or DNA (DAPI; blue) and imaged at ×63 magnification using the same exposure for each sample. Scale bar, 10 μm. Individual panels were converted to black and white and inverted to visualize the loss of IncE staining. These data are from three biological replicates. (B) C. trachomatis L2-infected HeLa cells were fixed at 18 hpi and stained for immunofluorescence to observe IncE (green), MOMP (red), and DNA (blue). Coverslips were imaged using the same exposure for each sample at ×63 magnification. Scale bar, 10 μm. (C) The intensity of IncE was measured using ImageJ from a minimum of 80 inclusions per experiment (see Materials and Methods). For each image, the background integrated density was subtracted from individual images, and the intensity was normalized to the inclusion perimeter (integrated density/μm). The mean integrated density/μm is reported in red for each sample measured. The intensity (integrated density/μm) and standard deviation were plotted using GraphPad Prism 8.4.0. Samples were analyzed for statistical significance using a one-way ANOVA and Tukey’s multiple-comparison test. ****, P < 0.0001 between C. trachomatis L2 transformed strains; ####, P < 0.0001 between C. trachomatis L2 transformed strains.
