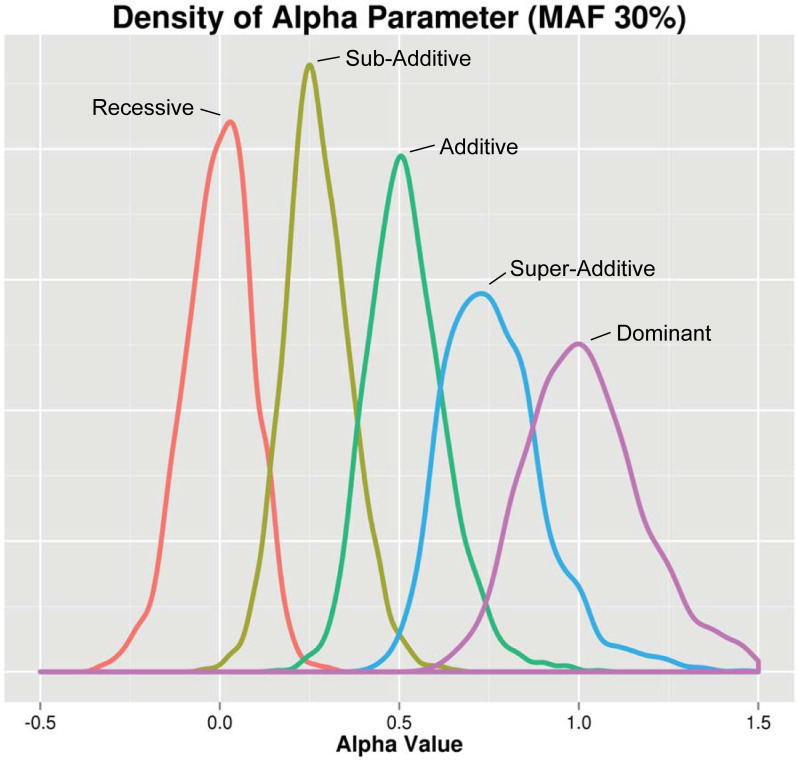
Fig 1. Distribution of the estimated heterozygous action (α).
Single SNP simulations were performed with five distinct underlying models: recessive (red), sub-additive (yellow), additive (green), super-additive (blue), and dominant (purple). All SNPs shown in this figure were simulated with a 30% MAF. 1,000 datasets for each SNP model were generated and the distribution of the alpha parameter was plotted. Along the x-axis is the EDGE assigned alpha value for simulated SNPs of each genetic model and along the y-axis is the density.

