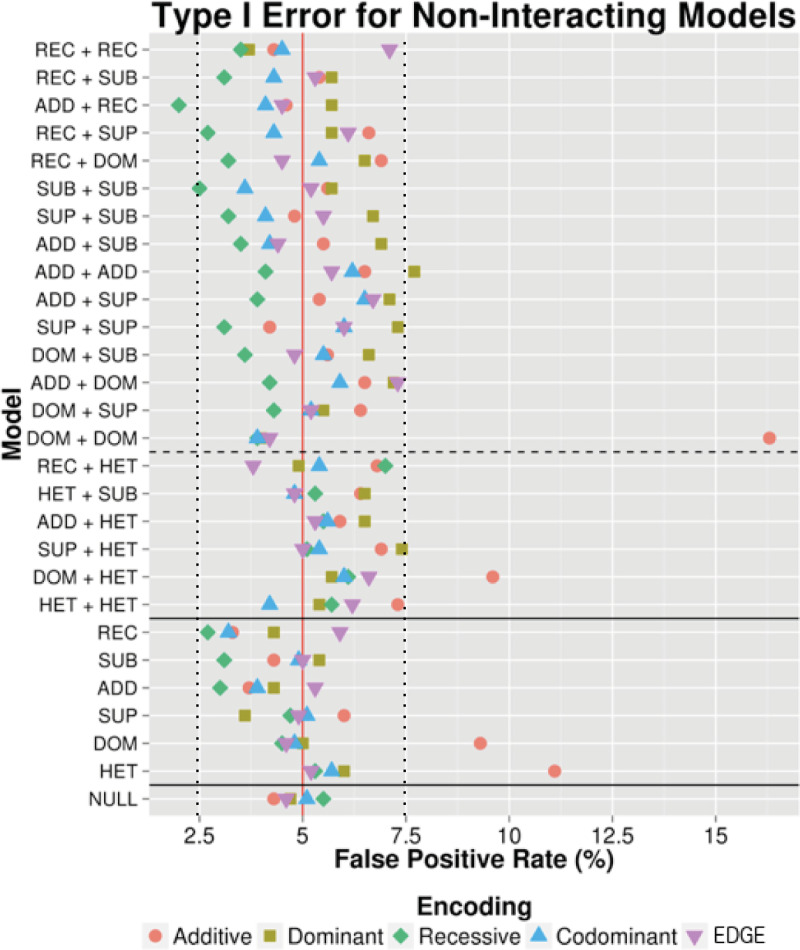
Fig 2. Type I error in simulated main effect and null data.
Power to detect two-SNP (above the top solid horizontal line) and One-SNP (below top solid line) main effect simulations are displayed. Null model simulations are shown below the bottom solid horizontal line. The dashed horizontal line separates models involving HET SNPs (below dashed line) from non-HET SNPs (above the dashed lines) because the homozygous genotypes in HET SNPs were simulated to have 0 risk relative to the heterozygous genotype, while the homozygous alternate genotypes for all other SNPs were simulated to have full risk comparted to heterozygotes. Main Effect Only models and null data were simulated (1,000 datasets each) and LRT p-values were calculated using additive (red circle), dominant (yellow square), recessive (green diamond), codominant (blue triangle), and EDGE (purple inverted triangle) encodings to identify the percentage of time each encoding identified a significant interaction when there was none (false positive rate). The red vertical line marks a 5% false positive rate and the dashed black lines mark where the estimated type I error should fall within according to Bradley’s liberal criteria [32]. All SNPs in this figure were simulated with a 30% minor allele frequency.

