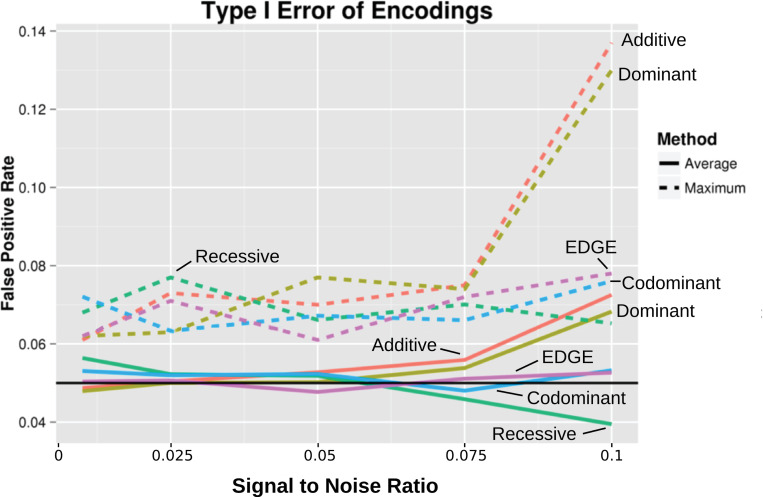
Fig 3. Average and maximum type I error across all main effect and null simulated datasets.
Average false positive rates (solid lines) and the false positive rate for the maximum inflated model (dashed lines) were calculated for standardized signal to noise ratios. Values are plotted at increasing signal to noise ratios for each encoding: additive (red), dominant (yellow), recessive (green), codominant (blue), and EDGE (purple). The black line denotes a 5% false positive rate.

