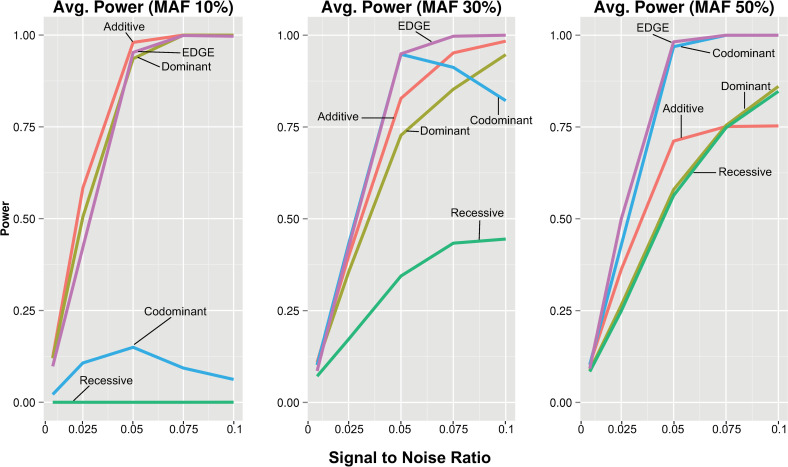
Fig 5.
Average power for standardized signal to noise ratio across all pairwise interaction models at 10%, 30% and 50% MAF. Average power of each encoding was calculated for standardized signal to noise ratios and plotted by increasing signal to noise ratios for the pairwise model SNP-SNP interaction models using each encoding: additive (red), dominant (yellow), recessive (green), codominant (blue), and EDGE (purple).

