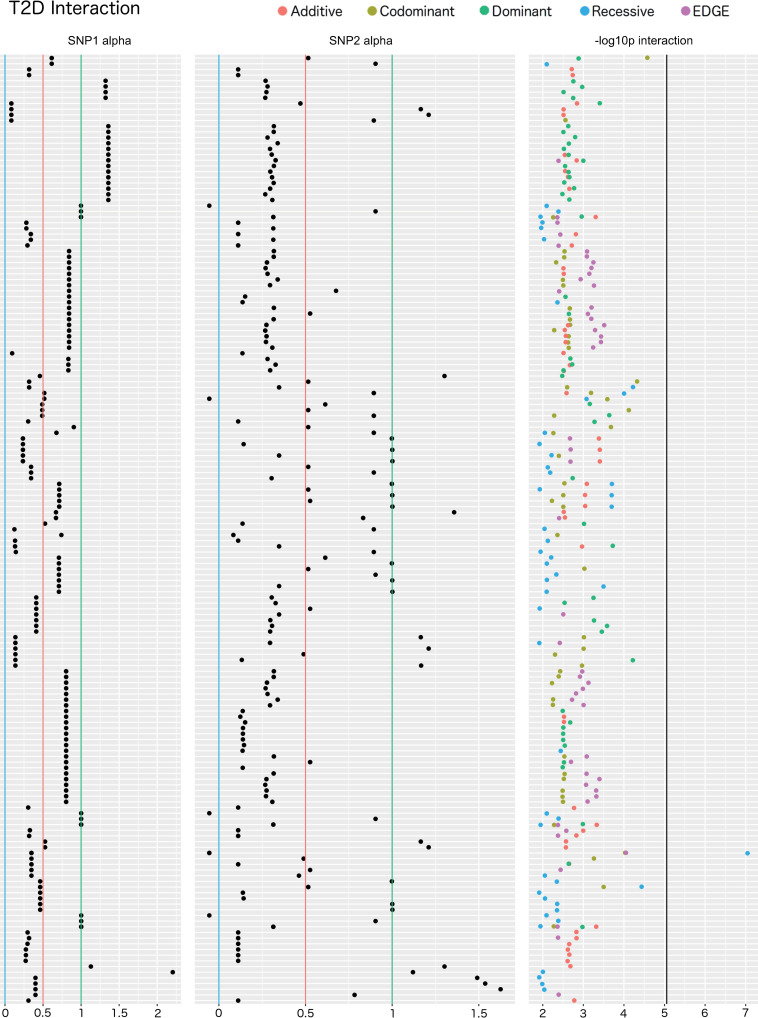
Fig 10. Interaction plot of the top results from the main effect filtered SNP-SNP interaction analysis for T2D.
The top 50 SNPs from the multi-encoding T2D GWAS for each traditional encoding were considered for a pairwise SNP-SNP interaction analysis using additive (red), dominant (green), recessive (blue), codominant (yellow) and EDGE (purple) encoding methods. Track one displays the EDGE-derived heterozygous alpha value of SNP 1, track 2 displays the alpha value for SNP 2, and track 3 displays the–log10 of the unadjusted LRT p-value of each SNP-SNP interaction model. Vertical blue lines denote a 0 alpha value (indicative of recessive genetic model), vertical red lines denote a 0.5 alpha value (indicative of additive genetic model), vertical green lines denote an alpha value of 1 (indicative of dominant genetic model). Note that some of the SNPs demonstrated alpha values outside the 0–1 range, indicative of under-recessive (α < 0) and over-dominant (α > 1) genetic models. The vertical black line denotes the Bonferroni significance threshold for this analysis (5,671 SNP-SNP models tested).

