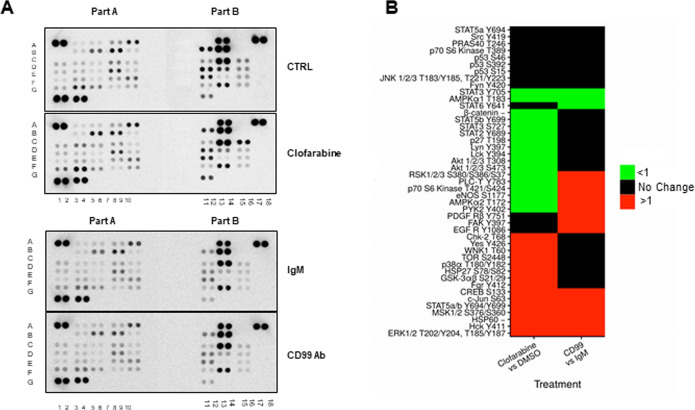
Fig 2. Phosphokinase array analysis of STA-ET.7.2 cells after treatment with clofarabine and CD99 antibody.
(A) Phosphokinase screening of cells treated with clofarabine (0.6 μM) and DMSO (upper pair) or CD99 antibody (15 μg/ml), and IgM (15 μg/ml) (lower pair). Protein coordinates of the kinase array are given in S1 Fig; (B) Analysis of band intensity after treatment with clofarabine and CD99 antibody is given. Red color indicates increased phosphorylation, black color indicates no change and green color indicates decreased phosphorylation compared to control in each group. ERK1/2, MSK1/2, CREB, c-Jun, HSP60, Hck and STAT5 phosphorylation levels were increased while STAT3 and AMPKα1 were decreased for both treatment groups.

