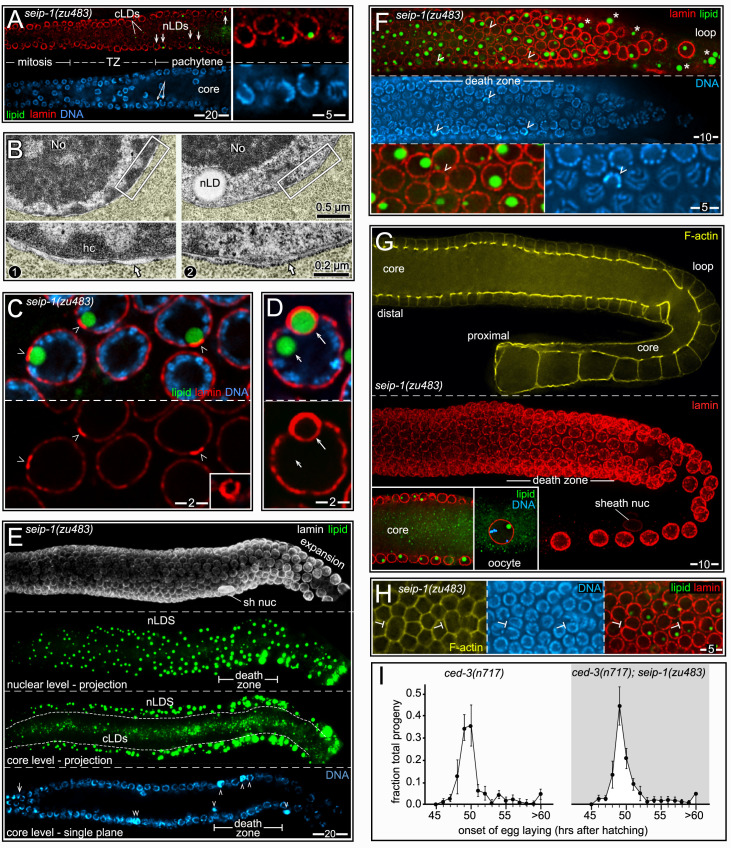
Fig 15. Characterization of nLDs in seip-1(zu483) gonads.
(A) Mitotic to early pachytene region of a seip-1(zu483) gonad, showing the first appearance of nLDs (arrows and inset) in cells passing through the transition zone (TZ, see Fig 10A). (B) TEM of seip-1(zu483) germ cells. The left panel shows an interphase nucleus from the mitotic zone, which lacks nLDs. The right panel shows an early pachytene-stage nucleus with an nLD. The early pachytene nucleus has relatively little peripheral heterochromatin (hc), and far more ribosomes on the ONM (arrows). (C) Early pachytene region of seip-1(zu483) gonad showing lamin concentrated in patches at the base of each nLD. The inset is an orthogonal view of a single lamin patch, showing the asymmetric, horseshoe shape. (D) seip-1(zu483) germ cell showing a rare example of an nLD that appears to be coated with lamin (long arrow). The germ cell is also atypical in containing a second nLD (short arrow). (E) Image of the nLD-containing area of a seip-1(zu483) D2 gonad, from early pachytene to the loop region. The gonad is stained for lamin (white, LMN-1/lamin), lipid (green, BODIPY), and DNA (blue, DAPI). The projections are of 6 μm z-stacks. Essentially all lipid droplets visible in the nuclear level are nLDs, while the core projection shows cLDs in the core and nLDs in the flanking, peripheral nuclei. Note that the core cLDs are much smaller than the nLDs. The bottom panel shows nuclei (DAPI, blue) in a single focal plane through the middle of the gonad; the arrow at far left indicates transition zone nuclei as in Fig 15A. Arrowheads point to apoptotic nuclei with compacted DNA, and the double arrowhead indicates a binucleate apoptotic cell (see also Fig 11D). Note that large numbers of germ cells retain nLDs at they pass through the major death zone. (F) Comparison of nuclear sizes in the mid-pachytene to loop region of a D1 seip-1(zu483) gonad; staining shown for lamin (red, LMN-1), lipid (green, BODIPY), and DNA (blue, DAPI). The image is a single optical plane through the top nuclear level. Most nuclei increase in size uniformly from distal to proximal, but three nuclei (arrowheads) are noticeably smaller than their neighbors; the DNA panel shows that these nuclei are apoptotic with compacted chromatin. The large, lipid-containing objects that are not nuclear (asterisks) are within phagocytic sheath cells that engulf apoptotic germ cells (see S11 Fig for additional details). (G) Comparison of germ cell sizes in a seip-1(zu483) gonad; cell boundaries are outlined by F-actin (yellow, phalloidin), and nuclei are stained for lamin (red, LMN-1). Note the uniform increase in cell sizes as cells move distal to proximal; the insets show nLDs from two regions, including an nLD in an oocyte nucleus. (H) Binucleate cells in the early pachytene region of a seip-1(zu483) gonad; cell boundaries are indicated by staining for F-actin (yellow, phalloidin). The gonad contains low numbers of binucleate germ cells (T-bars), similar to wild type. Binucleate cells first appear in about the same region as nLDs, and undergo apoptosis as they move further proximal. When present, nLDs were usually found in both nuclei (23/28 binucleate cells), but could instead be in only one nucleus (5/28 binucleate cells). (I) Plot comparing the rate of larval development in apoptosis-defective ced-3(n717) mutants (n = 1581 larvae) with ced-3n717);seip-1(zu483) double mutants (n = 1445 larvae). Synchronous newly hatched larvae were allowed to develop and scored when they produced their first eggs. Most animals in both populations reached adulthood and began producing eggs at t = 49–50 hrs, but a small fraction of animals had not produced eggs by t = 60 hrs.

