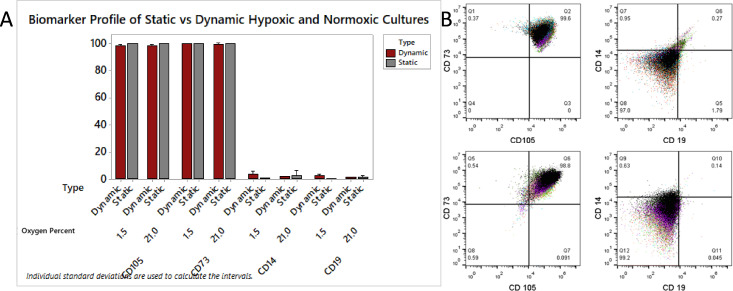
Fig 8. hMSC biomarker characterization using flow cytometry.
Cells were cultured in both static and dynamic bioreactor conditions, and compared using CD105, C73, CD19, and CD14 staining. B) Overlaid flow cytometry image of 1.5% O2 primed hMSC cultures from day seven dynamic bioreactors showing positive markers and negative markers.

