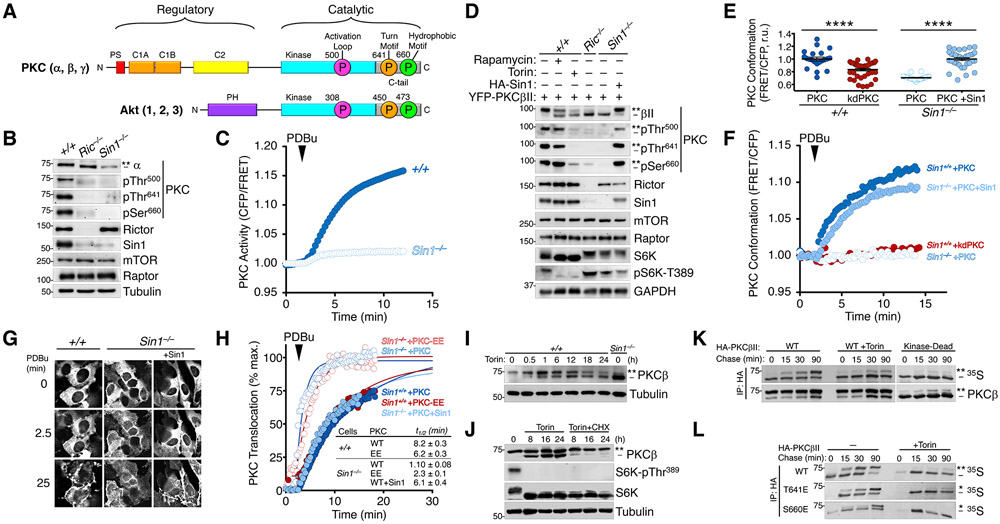
Fig. 1. Defect in PKC Maturation Upon Loss of mTORC2.
(A) Schematic of conventional PKC (cPKC) and Akt domain structures. cPKCs (α, β, γ) have an autoinhibitory pseudosubstrate (PS, red), tandem diacylglycerol sensing C1 domains (orange), and a Ca2+-dependent plasma membrane sensing C2 domain (yellow) in their N-terminal regulatory moiety and a kinase domain (cyan) and C-terminal tail (C-tail, grey) in the catalytic moiety. Akt has a PIP3-sensing PH domain and and a kinase domain (cyan) and C-terminal tail (C-tail, grey) in the catalytic moiety. Both kinases have three conserved phosphorylations at the activation loop (magenta) of the kinase domain and the turn motif (orange) and hydrophobic motif (green) in the C-tail, indicated with circles (PKCβII and Akt1 numbering). For PKC, these phosphorylations are constitutive whereas for Akt only the turn motif is constitutive, with the activation loop and hydrophobic motif phosphorylated in an agonist-dependent manner. The C-tail sites are mTORC2-sensitive.
(B) Western blot of Triton-solubilized lysates from WT (+/+), Rictor KO (Ric−/−), or Sin1 KO (Sin1−/−) MEFs probed with the indicated total and phospho-specific antibodies. The double asterisk (**) denotes the position of mature, fully-phosphorylated PKC and the dash (−) indicates the position of unphosphorylated PKC. Note the activation loop does not cause a mobility shift and is modified in C-terminally phosphorylated species. Blots are representative of three independent experiments.
(C) PKC activity in WT (+/+) or Sin1 KO (Sin1−/−) cells expressing the PKC activity reporter, CKAR, and treated with PDBu (200 nM) to maximally activate PKC. Data represent the normalized FRET ratio changes (mean ± SEM) from three independent experiments.
(D) Western blot of Triton-solubilized lysates from WT (+/+), Rictor KO (Ric−/−), or Sin1 KO (Sin1−/−) MEFs, expressing YFP-PKCβII and HA-Sin1, treated with Rapamycin (10 nM; 24 h) or Torin (200 nM; 24 h), and probed with the indicated antibodies. Mobility shifts as described in B. Blots are representative of three independent experiments.
(E) Basal conformation of PKC analyzed using the conformational reporter Kinameleon which comprises a donor:acceptor pair flanking the N and C termini of PKC. Autoinhibited PKC has a low FRET ratio and the open conformation has high FRET ratio. Indicated are the FRET ratio (mean ± SEM) of PKCβII Kinameleon wild-type (WT) or kinase-dead K371R (KD) expressed without or with HA-Sin1 in WT (+/+) or Sin1 KO (Sin1−/−) MEFs. Each data point represents the FRET ratio from an individual cell relative to the average maximum signal in three independent experiments. ****p < 0.0001 by Student’s t-test.
(F) Agonist-induced conformational changes of PKCβII assessed using the reporter Kinameleon. Wild-type (WT) or kinase-dead K371R (KD) Kinameleon was expressed without or with HA-Sin1 in WT (Sin1+/+) or Sin1 KO (Sin1−/−) MEFs and treated with PDBu (200 nM) at the indicated time. Data represent the normalized FRET ratio changes (mean ± SEM) from three independent experiments.
(G) Fluorescence images of WT (+/+) or Sin1 KO (Sin1−/−) MEFs expressing PKCβII Kinameleon alone or with coexpression of HA-Sin1, before (0) or after treatment with PDBu (200 nM) for the indicated timepoints. Images are representative of three independent experiments.
(H) Analysis of plasma membrane translocation of mYFP-PKCβII WT or T641E/S660E (EE) in WT (+/+) or Sin1 KO (−/−) MEFs co-expressing myristoylated-palmitoylated mCFP with or without HA-Sin1, and treated with PDBu (100 nM). Data represent the FRET ratio signal from the CFP to YFP and are normalized to the maximum FRET ratio signal determined by fitting the data to a single phase logarithmic nonlinear regression (solid lines). Data represent the normalized FRET ratio changes (mean ± SEM) from three independent experiments.
(I) Western blot of Triton-solubilized lysates from WT (+/+) MEFs overexpressing PKCβII and treated with Torin (250 nM) for 24 h prior to lysis. Mobility shifts as described in B. Blots are representative of three independent experiments.
(J) Western blot of Triton-solubilized lysates from COS7 cells transfected with cDNA for PKCβII for 24 h prior to treatment with Torin (250 nM) and Cycloheximide (250 μM) for the indicated times. Mobility shifts as described in B. Blots are representative of three independent experiments.
(K) Autoradiogram (detecting 35S-labeled newly-synthesized PKC) and Western blot (detecting total pool of PKC) of HA immunoprecipitates from a pulse-chase analysis of COS7 cells expressing HA-PKCβII WT or K371R (Kinase-Dead) and treated with Torin (250 nM) during the chase. Mobility shifts as described in B. Blots are representative of three independent experiments.
(L) Autoradiogram (detecting 35S-labeled newly-synthesized PKC) and Western blot (detecting total pool of PKC) HA immunoprecipitates from a pulse-chase analysis of WT MEFs expressing the indicated HA-PKCβII constructs and treated with Torin (250 nM) during the chase. The double asterisk (**) denotes the position of mature, fully-phosphorylated PKC; the single asterisk (*) denotes the position of PKC phosphorylated at either the turn motif or hydrophobic motif; and the dash (−) indicates the position of unphosphorylated PKC. Blots are representative of three independent experiments.

