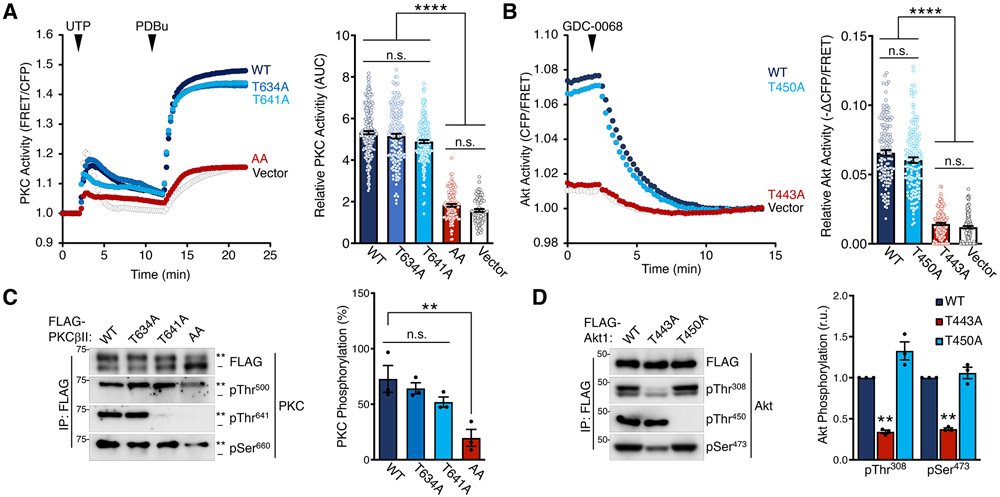
Fig. 5. TOR-Interaction Motif Phosphorylation is Critical for PKC and Akt Activity.
(A) PKC activity in COS7 cells expressing CKAR2 (48) alone or with mCherry-PKCβII WT, T634A, T641A, or T634A/T641A (AA) and treated with UTP (100 μM) and then PDBu (200 nM) at the times noted. Data represent the normalized FRET ratio changes (mean ± SEM) from three independent experiments. (right) Quantification of PKC activity represents the normalized area under the curve from baseline of 1.0 (AUC; mean ± SEM) for the 20 min following UTP addition. Each data point reflects AUC of single cells from three independent experiments.
(B) Akt activity in COS7 cells expressing BKAR and mCherry-mAkt1 kinase domain (a.a.141-480) WT, T450A, or T443A and treated with the Akt inhibitor GDC-0068 (20 μM). The drop in FRET upon inhibitor addition indicates the degree of basal activity of the isolated kinase domain. Data represent the normalized FRET ratio changes (mean ± SEM) from three independent experiments. (right) Quantification of basal Akt activity measured by magnitude of the FRET change (mean ± SEM) 12 min after inhibitor addition. Each data point reflects AUC of a single cells from three independent experiments.
(C) Western blot of FLAG immunoprecipitates from Triton-solubilized lysates of HEK-293t cells expressing FLAG-PKCβII WT, T634A, T641A, or T634A/T641A (AA) and probed with the indicated antibodies. (right) Quantification of PKC phosphorylation (mean ± SEM) from three independent experiments represents the percent of the slower-mobility, phosphorylated species (**) over total PKC. Blots are representative of three independent experiments.
(D) Western blot of FLAG immunoprecipitates from Triton-solubilized lysates of HEK-293t cells expressing FLAG-Akt1 catalytic domain (a.a.141-480) WT, T443A, or T450A constructs and probed with the indicated antibodies. (right) Quantification of Akt phosphorylation (mean ± SEM) from three independent experiments reflects the normalized phospho-signal relative to total Akt for the activation loop (pThr308) or hydrophobic motif (pSer473). Blots are representative of three independent experiments.
**p < 0.01; ****p < 0.0001; n.s., not significant by One-way ANOVA and Tukey HSD Test or Student’s t-test. Western blot quantifications represent the mean ± SEM from at least three independent experiments.

