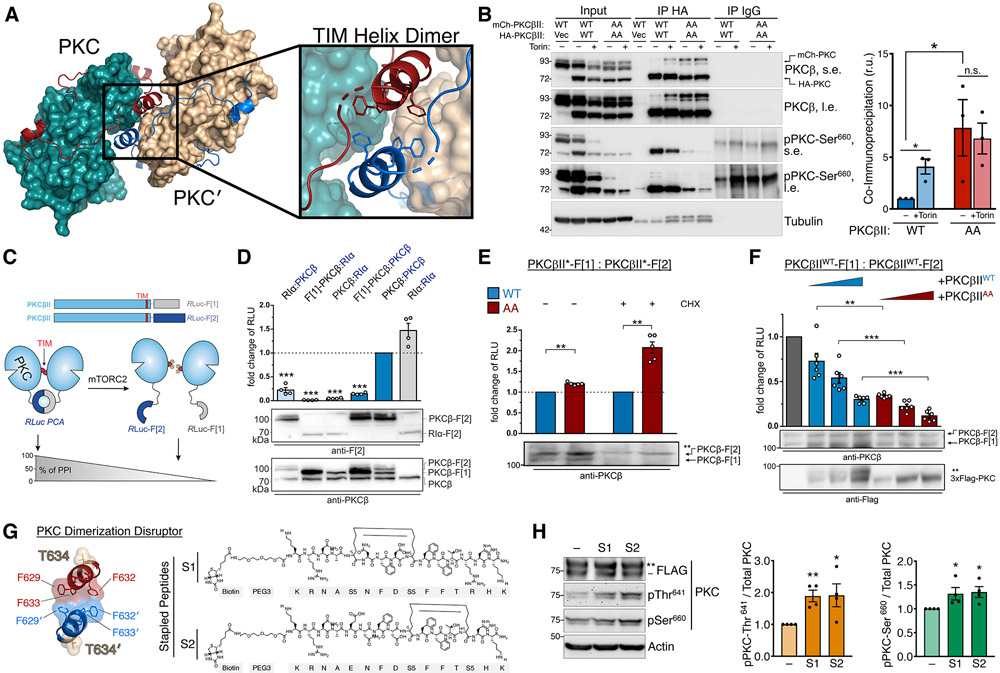
Fig. 6. The TOR-Interaction Motif Coordinates PKC Dimerization.
(A) PKC dimer from PKCβII X-ray structure (PDB ID: 2I0E) showing the PKC kinase (teal) and C-tail (red) with dimer partner (PKC′) kinase (tan) and C-tail (blue). The dimerization interface at the TOR-interaction helix (TIM Helix) is shown with interacting Phe residues.
(B) Western blot of Triton-solubilized lysates (Input) and HA or IgG control immunoprecipitates from HEK-293t cells expressing HA- and mCherry-PKCβII WT or T634A/T641A (AA), and probed with the indicated antibodies. s.e., short exposure; l.e., long exposure. (right) Quantification of immunoprecipitated mCherry-PKC normalized to the input mCherry-PKC (mean ± SEM) from three independent experiments.
(C) Domain organization of PKCβII constructs tagged with the Renilla luciferase (Rluc) based protein-fragment complementation assay (PCA) fragments Rluc-F[1] and Rluc-F[2]. Scheme illustrates an involvement of the PKC TOR-interaction motif (TIM) in PKC dimer formation analyzed using the PCA system. PKC dimerization induces the complementation of Rluc fragments and bioluminescent signal reflects the indicated protein-protein interactions (PPI).
(D) Indicated C-terminally tagged Rluc PCA reporter constructs were transiently co-expressed in HEK293 cells (the exception is the N terminally tagged F[1]-PKCβ). Data are presented as the fold change of bioluminescent signals (relative light units (RLU)) relative to PKCβII homodimer formation. Each point represents the mean value of an individual experiment performed at least in triplicate; bars indicate the mean ± SEM from four independent experiments. The PKA subunit RIα was used as a dimerization positive control.
(E) PKC dimer formation of PKCβII WT and T634A/T641A (AA), measured in the presence or absence of cycloheximide (CHX; 250 μM for 6 h), assessed by the RLuc PCA reporter assay as in (D). Data are presented as the fold change of the PPI signal relative to the WT PKCβII dimer signal. Each point represents the mean value of an individual experiment performed at least in triplicate; bars indicate the mean ± SEM from five independent experiments. *p< 0.05; **p<0.01; ***p<0.001; n.s., not significant by paired Student's t-test.
(F) Effect of increasing expression of FLAG-PKCβII WT or T634A/T641A (AA) on dimer formation of PKCbII-Rluc-F[1] and PKCbII-Rluc-F[2]. Data are presented as the fold change of the PPI signal in relation to the mock control. Each point represents the mean value of an individual experiment performed at least in triplicate; bars indicate the mean ± SEM from three independent experiments. *p< 0.05; **p<0.01; ***p<0.001; n.s., not significant by One-way ANOVA.
(G) Dimerization interface of the TIM helix showing hydrophobic interactions and TIM phosphorylation site (T634). Kekulé structures of two PKC Dimerization Disruptor (PKC-DD) stapled peptides targeting the TOR-interaction motif.
(H) Western blot of HEK293t cells expressing FLAG-PKCβII, treated with 10 μM of the indicated PKC-DD stapled peptides for 24 h prior to lysis, and probed with the indicated antibodies. (right) Quantification represents the amount of PKC phosphorylated at Thr641 or Ser660 normalized to total PKC from three independent experiments.
*p < 0.05; **p<0.01; ***p<0.001; n.s., not significant by Student’s t-test or One-way ANOVA. Error bars represent SEM from at least n=3 experiments.

