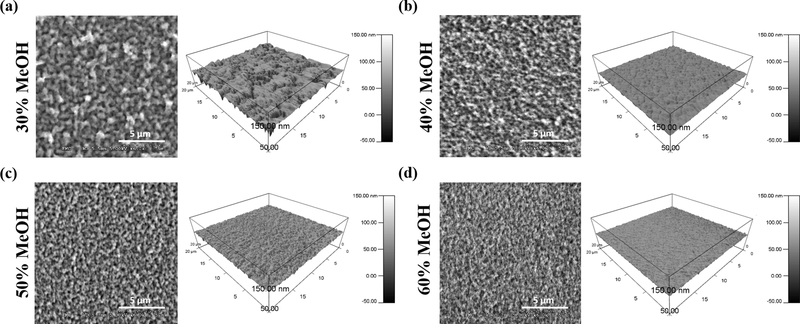
Figure 6.
Topography of MeOH-annealed silk films imaged with SEM and AFM. 2D images on the left correspond to dehydrated films imaged with SEM, while 3D images on the right correspond to hydrated films measured with AFM for (a) 30% MeOH-annealed (b) 40% MeOH-annealed (c) 50% MeOH-annealed and (d) 60% MeOH-annealed silk films. As MeOH-annealing concentration increases, silk particles become smaller and more densely packed.

