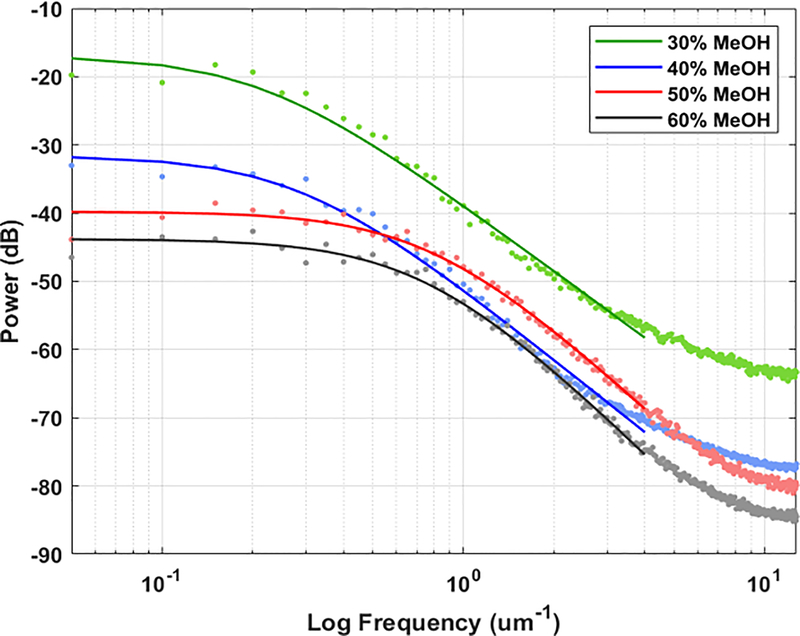
Figure 7.
Power spectral density of 30%, 40%, 50%, and 60% MeOH-annealed silk film topographies acquired from AFM data. The data was fitted with the ABC model (Eq.1), shown in the dashed lines, and the fitted A, B, and C coefficients were used to calculate the RMS roughness and correlation length of the film surfaces.

