Table 1.
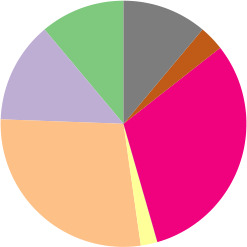
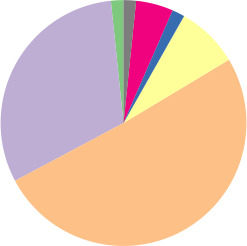
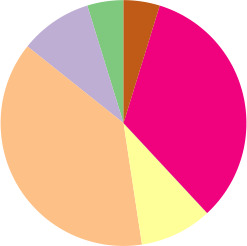
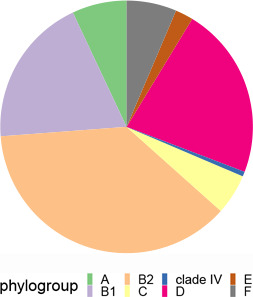
Table of the distribution of the different AmpC promoter and attenuator variants, as well as the numbers of different MLST STs and phylogroups per grouped genotype (pampC, putative hyperproducers and putative low-level AmpC producers)
|
Genotype |
Isolate |
Promoter variant |
Attenuator variant |
MLST |
Phylogroup |
|---|---|---|---|---|---|
|
pampC |
n=90 |
3 variants |
6 variants |
44 STs and 4 unknown |

|
|
Putative hyperproducers |
n=61 |
13 variants |
14 variants |
30 STs and 5 unknown |

|
|
Putative low-level AmpC producers |
n=21 |
8 variants |
5 variants |
14 STs and 4 unknown |

|
|
Total |
n=172 |
21 variants |
18 variants |
75 STs and 13 unknown |

|
