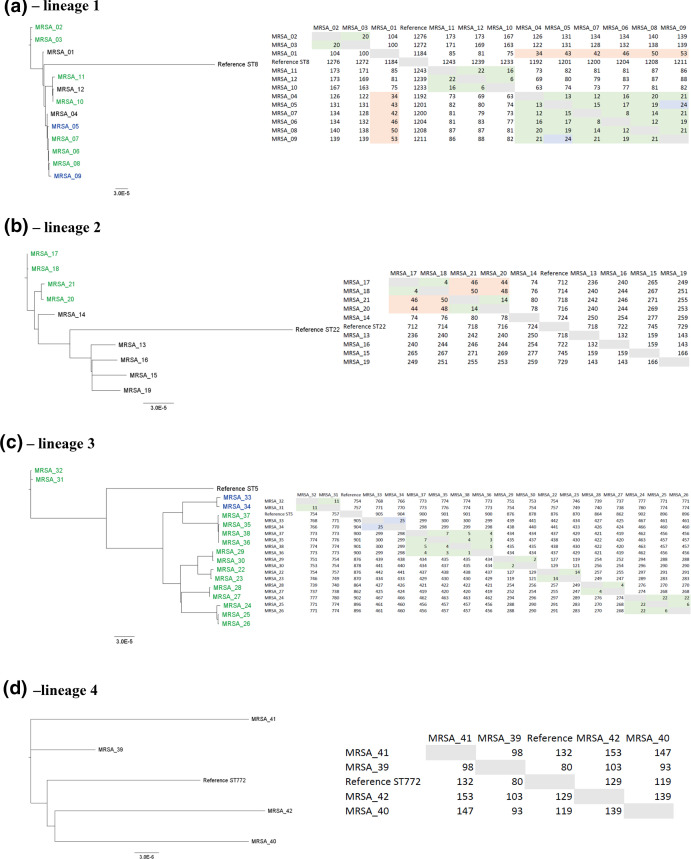
Fig. 2.
Phylogenetic comparison of the MRSA isolates using the nanopore-based protocol. The isolates were grouped by lineage (defined according to Table 1). Phylogenetic trees are shown on the left, while the table containing the pairwise distances (number of SNPs) between the isolates are shown on the right. The name of the isolates highlighted in green or blue were designated as part of outbreaks (left) defined after nanopore analysis. The numbers highlighted in green display≤22 SNPs, representing the isolates that were genotypically indistinguishable. The numbers highlighted in blue display 23–30 SNPs, representing samples defined as genotypically closely related. The numbers highlighted in orange (31–60 SNPs) represent isolates defined as possibly closely related. Finally, names and numbers not highlighted represent sporadic isolates. All the phylogenetic trees and SNP analysis were carried out using realphy online pipeline [21].

