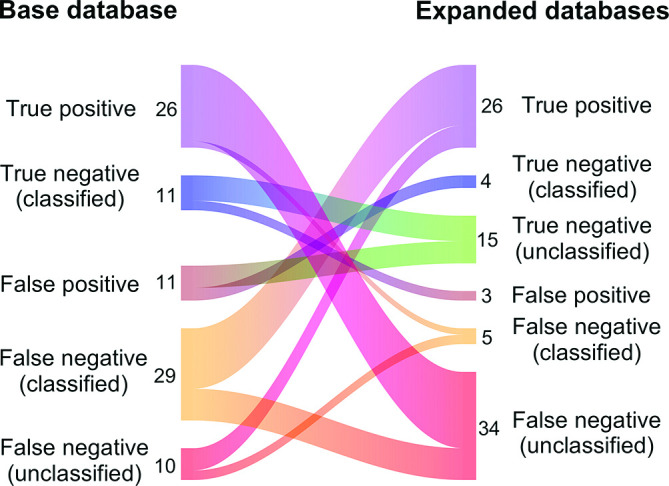
Fig. 2.

Classification results for 87 contigs that were classified into different categories after expanding the Kraken database. Contig number for each category is shown next to the diagram. Note that contigs classified into the same category are not shown in this figure (n=5218 contigs). The Sankey diagram was created using the riverplot R package (v0.6).
