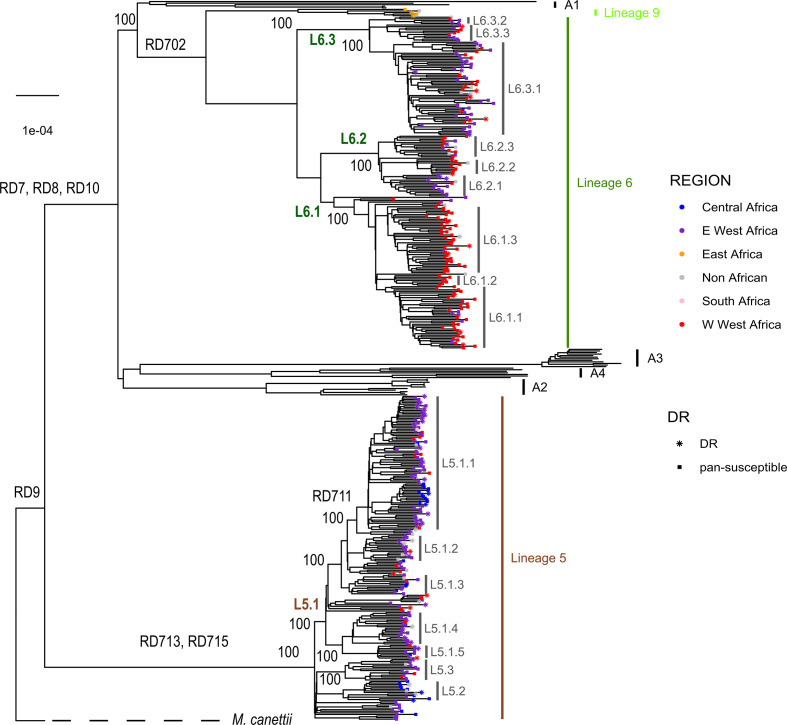
Fig. 1.
Maximum-likelihood phylogeny of 424 M . africanum genomes analysed together with animal-associated genomes used as references. Support bootstrap values are indicated at the nodes. The scale bar indicates the number of nucleotide substitutions per site. Nodes are coloured according to country or origin, and the shape of the node indicates susceptible or drug resistance based on absence or presence at least one of the drug-resistance mutations indicated in Table S8.

