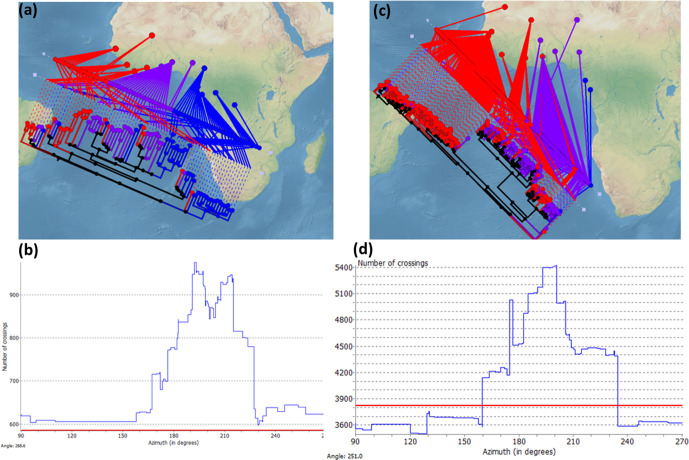
Fig. 4.
Phylogeographical structure in L5 and L6. Linear axis plot between the genomic phylogeny and the geographical origin of the genomes for L5 (a) and L6 (c), with minimum crossing between each leaf node in the phylogeny and its geographical distribution. Histograms show the number of crossing for each inclination of the axis, and the red lines indicate the number of crossings expected by chance for L5 (b) and L6 (d).

