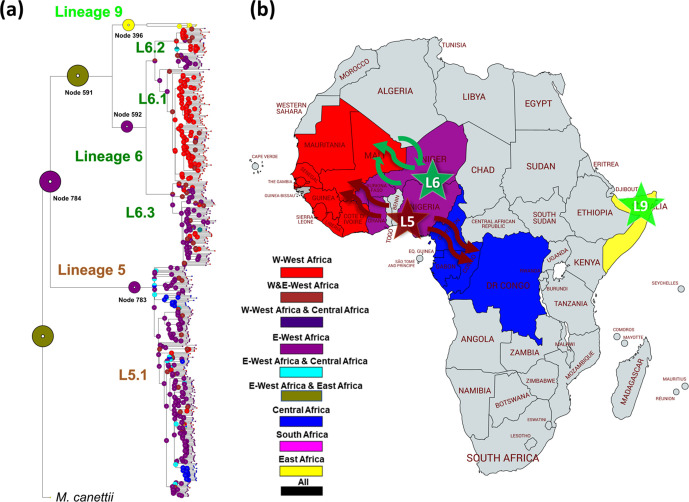
Fig. 5.
Geographical ancestral distributions of L5, L6 and L9. (a) Ancestral area reconstruction by the Bayesian binary model onto the maximum-likelihood phylogeny. Circles represent the probabilities of ancestral ranges, and the most likely ancestral areas are indicated by their corresponding colour codes. (b) The four geographical areas considered in this analysis are coloured in the map, the most likely ancestral areas for each lineage are shown as stars, and movements of strains inferred from phylogeny indicated as arrows. The map was created using Mapchart (https://mapchart.net/africa.html).

