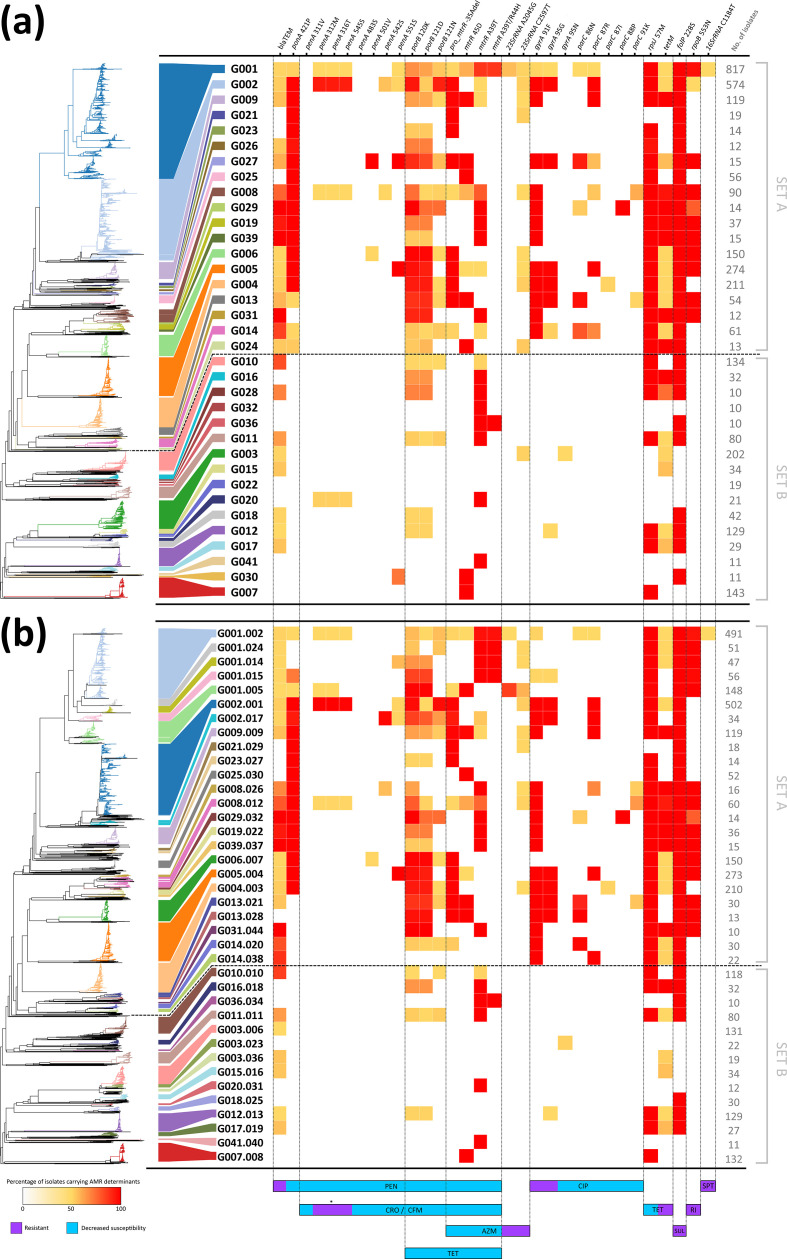
Fig. 3.
Heatmap distribution and occurrence of the genetic determinants involved in AMR by high-level (a) and low-level (b) WGS-based genogroups. Genetic determinants are ordered by the affected antimicrobial drug class/antibiotic, with resistance or decreased susceptibility effect described at the bottom. Heatmap colour range correlates with the percentage of isolates carrying each genetic determinant within a given WGS-based genogroup. The numbers of isolates within each genogroup are presented on the right of each panel. The contextual neighbour-joining phylogenetic tree at the left side of each panel was generated based on the MScgMLST allelic profiles using GrapeTree v1.5.0 software [56]. The asterisk indicates that the combination of these three mutations has been proposed as potentially inducing resistance to cephalosporins [8]. AZM, Azithromycin; CFM, cefixime; CIP, ciprofloxacin; CRO, ceftriaxone; PEN, penicillins; RI, rifampicin; SPT, spectinomycin, SUL, sulphonamides; TET, tetracycline.

