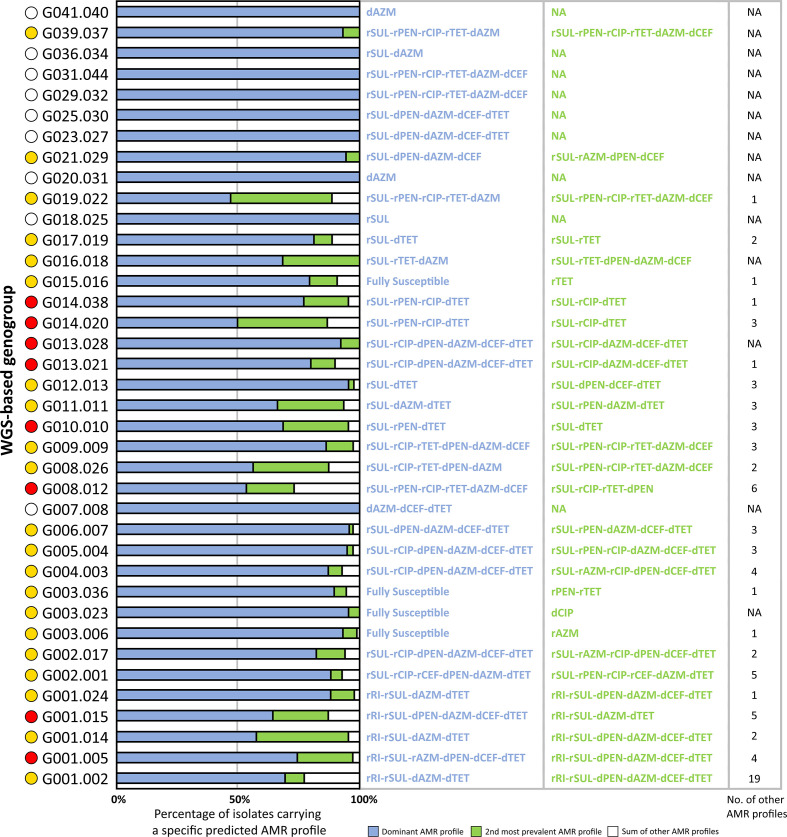
Fig. 4.
Major predicted AMR profiles observed within each low-level genogroup. Yellow circles indicate genogroups where the dominant AMR profile exhibits less genetic determinants associated with resistance than the second observed profile, for multiple classes of antimicrobials. Red circles indicate genogroups where the dominant AMR profile exhibits more genetic determinants associated with resistance for multiple classes of antimicrobials. White circles indicate genogroups with a unique AMR profile. AZM, Azithromycin; CEF, cephalosporins; CIP, ciprofloxacin; NA, not applicable; PEN, penicillins; RI, rifampicin; SUL, sulphonamides; TET, tetracycline. dXXX indicates decreased susceptibility to the named antibiotic, while rXXX indicates resistance to the named antibiotic.

