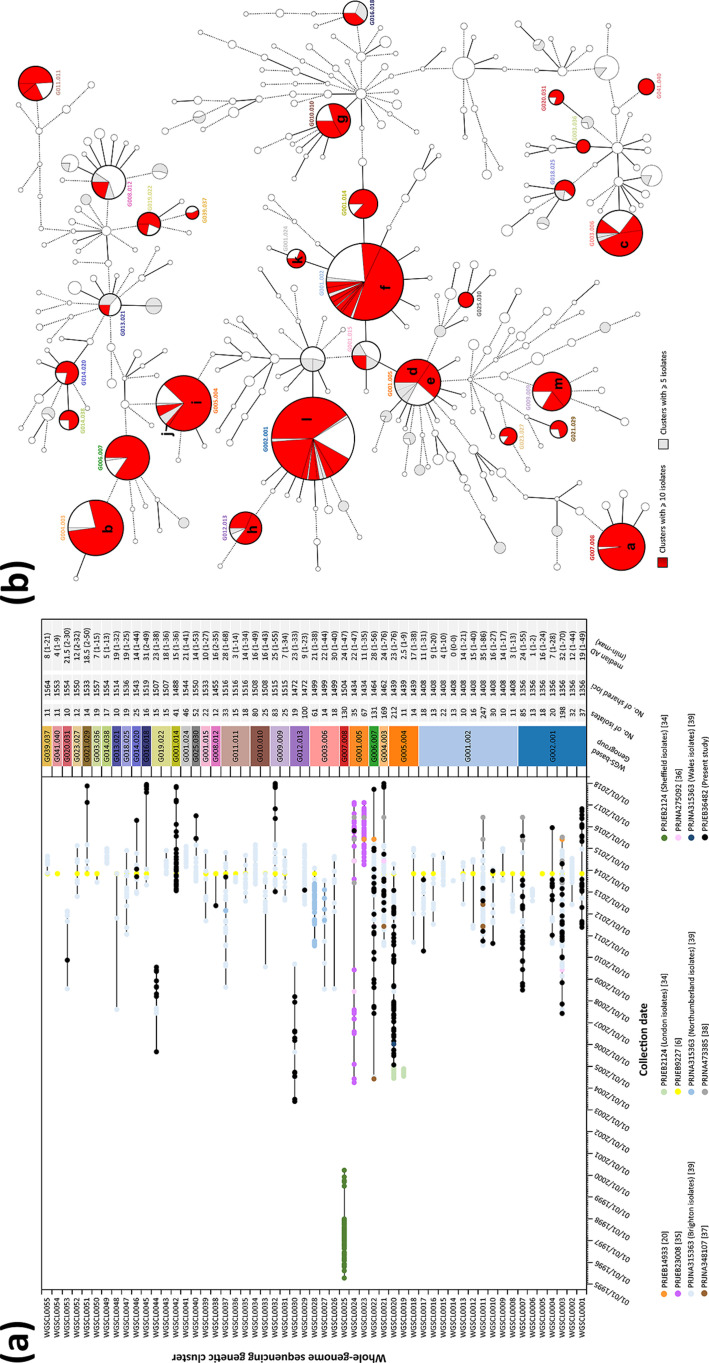
Fig. 5.
Analysis of N. gonorrhoeae WGS-based genetic clusters at low-resolution level potentially concordant with epidemiological link. (a) Genetic cluster isolates’ distribution by collection date, with detailed data of each cluster presented on the right. Each isolate colour refers to a specific study, and black lines link the earliest and latest isolate detected. Numbers in parentheses in the figure key refer to the study reference. (b) MST (also described in Fig. 2) of all isolates analysed in the present study highlighting WGS genetic clusters identified at a conservative threshold of 1.5 % AD. Nodes (which represent a unique allelic profile) presenting an allelic distance below 40, corresponding to the low-level genogroup threshold, have been collapsed for visualization purposes. The letters within (b) represent the following: a, WGSCL0025 Sheffield outbreak described in [34]; b, WGSCL0021 including cluster ST2400 described in [39] and the ST2400 MSM-associated isolates described in [6]; c. WGSCL0028 North-East England outbreak described in [39]; d, WGSCL0024 clade 2 described in [35]; e, WGSCL0023 Leeds outbreak [20] plus clade 1 and 3 described in [35]; f, WGSCL0011 large cluster ST2992 described in [39]; g, WGSCL0034 cluster ST26 described in [39]; h, WGSCL0029 cluster ST292 described in [39]; i and j, WGSCL0019 and WGSCL0020 London outbreaks described in [34]; k, WGSCL0041 small cluster ST2992 described in [39]; l, WGSCL0003 cluster ST1407, which includes linked isolates from Brighton and London described in [39], and isolates described as cephalosporin resistant in [6]; m, WGSCL0032, the ST4995 MSM-associated isolates described in [6].

