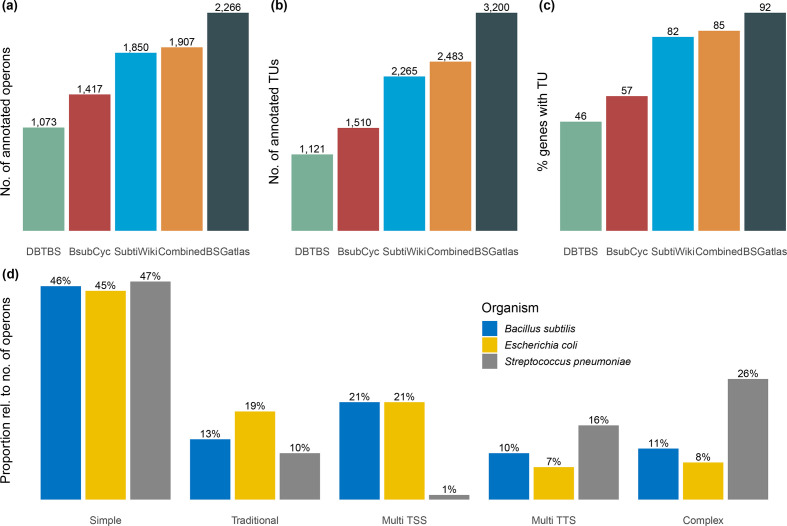
Fig. 2.
Comparing the different resources with respect to the number of (a) operons, (b) TUs and (c) the proportion of the merged gene set they cover. Here, the numbers in the ‘combined’ case (orange bars) refer to the annotation before computing novel TUs. (d) Comparison of the operon classes for our computed operons in B. subtilis with those found in S. pneumoniae and E. coli [10, 77].

