Fig. 3.
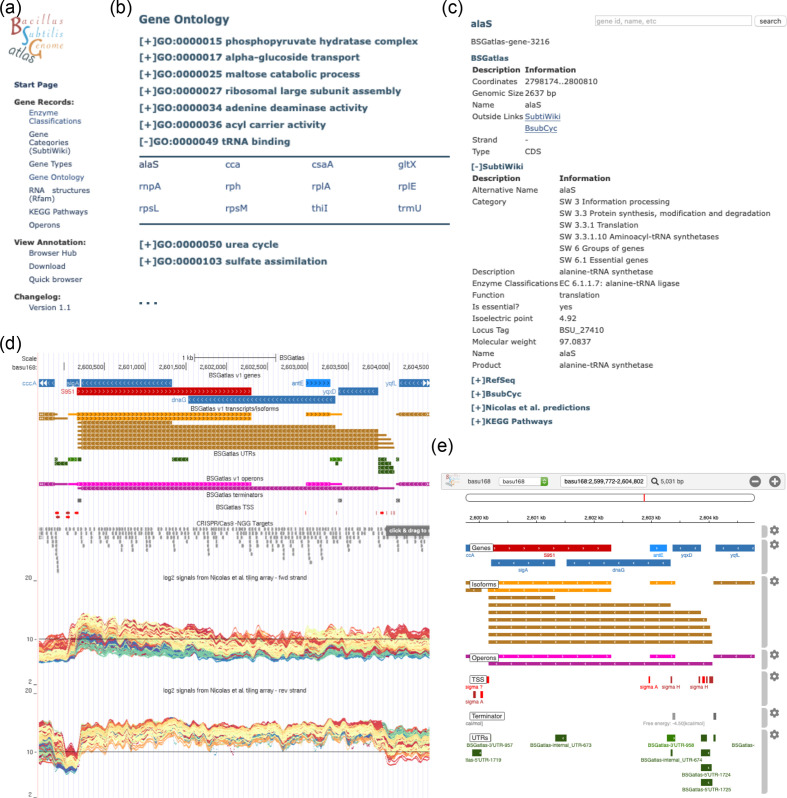
Illustration of the BSGatlas and its features. (a) The BSGatlas start page provides the main groups of navigational entries that lead to either the gene records, the search function or the various visualization options. (b) The gene record pages have the same structure across each classification system, these are gene types, enzyme classes or functional classification as listed in SubtiWiki or GO terms (a subset is shown in the figure). Each group is shown as a clickable entry, which list its associated genes. The gene names are shown as links to (c) detailed description pages. These show all meta-information we found for all genes and all other annotated entries, such as transcripts and operons. (d) UCSC genome browser. The user has the option to directly show the BSGatlas annotation as an assembly hub in the UCSC browser. Thus, they can also show their data, e.g. an RNA-seq experiment, right next to the annotation. Underneath the UCSC browser panel, a user can control details of what parts of the BSGatlas are shown. In addition, this includes the gene coordinates as they were originally annotated, which allows a closer investigation of the gene merging process. Here, a user can also opt-in to show the predicted CRISPR–Cas9 gRNAs and the signals from the tiling-array study. A click on the individual tracks shows more in-depth information on the guides and the tiling array colouration. (e) Quick browser. We provide a fast visualization directly on the BSGatlas main page, which allows a user to get a quick overview of the annotation without the need to leave the webpage. A click on any BSGatlas annotation redirects to the corresponding description page. (The browser is available at http://rth.dk/resources/bsgatlas/).

