
Fig. 3. Characterization of the OptoAAV system.
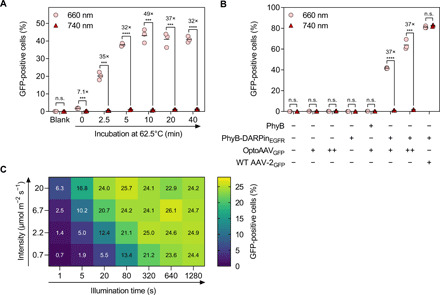
(A) Heating of OptoAAV. A-431 cells were incubated with heat-treated OptoAAVsGFP [multiplicity of infection (MOI), genomic particles per cell: 3.4 × 10⁴] and 50 nM PhyB-DARPinEGFR in PBS supplemented with 1% BSA for 2 hours under 740- or pulsed 660-nm illumination. Afterward, cells were washed and incubated in medium under continued illumination for 46 hours before analysis of transduced (GFP-positive) cells by flow cytometry. n > 5600 cells per sample. (B) Influence of OptoAAV components. A-431 cells were incubated for 2 hours in PBS supplemented with 1% BSA and 50 nM PhyB or PhyB-DARPinEGFR, OptoAAVGFP [MOI(+): 4.5 × 10⁴; MOI(++): 1.4 × 10⁵], or WT AAV-2GFP (MOI: 9.3 × 10³). The experiment was performed as in (A) with OptoAAVGFP preincubated at 62.5°C for 10 min. n > 300 cells per sample. (C) Dose dependency. A-431 cells incubated with 50 nM PhyB-DARPinEGFR and OptoAAVGFP (MOI: 2.8 × 10⁴) in PBS supplemented with 10% FCS were illuminated as indicated with 630-nm light and incubated afterward in the dark. Two hours after illumination started, cells were washed and incubated in medium for 46 hours under 740-nm light before flow cytometry analysis. Samples illuminated with 780-nm light within the first 2 hours showed 0.21% GFP-positive cells. Values obtained from biological duplicates. n > 3800 cells per sample. Mean is indicated. n.s., P ≥ 0.05; ***P < 0.001; ****P < 0.0001.