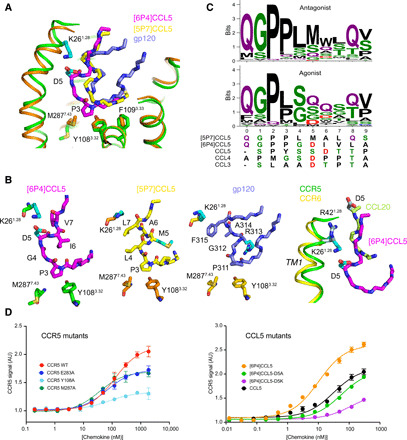
Fig. 3. Activation mechanism of CCR5 by [6P4]CCL5 at CRS2.

(A) Comparison of insertion depths of agonist [6P4]CCL5 (magenta), antagonist [5P7]CCL5 (yellow), and the antagonist V3 loop of gp120 (slate; PDB ID: 6MEO) into active CCR5 (green) and inactive CCR5 (orange). Important interacting residues are shown as sticks. (B) Detailed view of [6P4]CCL5 N terminus inserted into active CCR5, [5P7]CCL5 N terminus, and gp120 V3 loop inserted into inactive CCR5; and comparison of the insertion of [6P4]CCL5 N terminus into active CCR5 and of CCL20 N terminus into active CCR6 (PDB ID: 6WWZ). (C) Sequence composition of the N termini of CCL5 natural amino acid variants (table S2) with low (≤20%, N = 83, top) and high (≥50%, N = 34, bottom) calcium signaling. The N termini of [5P7]CCL5, [6P4]CCL5, and wild-type CCL3 to CCL5 (all agonists) are shown below. (D) Effect of CCR5 (left) and CCL5 (right) mutations on CCR5 signaling activity as monitored by Ca2+ flux measurements in human embryonic kidney (HEK) cells. Data points represent mean peak height ± SD (n = 3). Data shown are representative of two (left) or three (right) independent experiments. Fits to data points by a three-parameter response model are shown as solid lines. Respective fit values for Emax and EC50 are listed in table S3. AU, arbitrary units.
