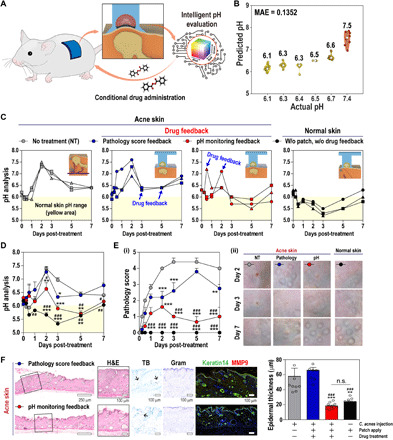
Fig. 5. Evaluating the feasibility of the H-s-DIA patch as a smart skincare system.

(A) Schematic illustration of a mouse study. (B) Scatter plot showing actual and predicted pH values of all data. (C to F) Effect of conditional drug administration in a mouse acne model. All groups except the no treatment (NT) group were treated with patch: the NT group received no drug treatment after acne induction (gray); the pathology score feedback (pathology) group received drug treatment if the pathology score was 4 or higher (blue); the pH monitoring feedback (pH) group received drug treatment if the skin pH value was 7 or higher (red); and the normal skin group did not induce acne (black). The pH value analyses in individual mice (C) and groups (D). (E) Skin pathology score analysis (i) and representative images of acne lesions in each group (ii). (F) Histological analyses of skin tissues using H&E, TB, Gram, and immunohistochemical staining. Scale bars, 250 μm or 100 μm. Black arrows indicate TB-positive cells. Quantification of epidermal thickness using H&E-stained specimens. One-way or two-way analysis of variance (ANOVA) was used to determine statistical significance. *P < 0.05, **P < 0.01, and ***P < 0.001 versus NT. #P < 0.05, ##P < 0.01, and ###P < 0.001 versus pathology score feedback. n.s., not significant.
