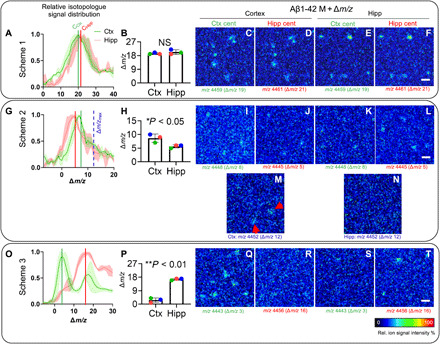
Fig. 3. Single Aβ plaque quantification identifies primary brain regions for plaque deposition.

Comparative analysis of MALDI-IMS spectral data of whole plaque ROI from cortex and hippocampus for Aβ1-42 isotopologue distributions. (A) The Δm/z value corresponds to the shift of the isotopologue signals compared to the unlabeled peptide signal. Centroid values (average Δm/z value) are calculated for the corresponding Aβ1-42 isotopologue distribution curves of whole plaques in the cortex (Ctx) versus hippocampus (Hipp) that serve as a measure of average label incorporation into Aβ1-42 in those regions. (B) For Scheme 1, statistical analysis of the centroid data shows no difference between cortical and hippocampal plaques. (C to F) Single ion images of the Aβ1-42 peptide isotopologue signal m/z at MAβ1-42 + Δm/z for each region (MAβ1-42 = 4440; m/z = 4440 + Δm/z). Because of the overlap of isotopologue distributions, no difference is observed for Scheme 1. (G to N) For Scheme 2, comparison of signal from individual plaques in cortex and hippocampus revealed higher 15N–Aβ1-42 signal being present in cortical plaques (H). (I to L) Single ion maps for Scheme 2 show that although better separated, both isotope distributions are still overlapping at their respective centroids. When comparing isotopologue signal at the maximally labeled Aβ1-42 detected in Scheme 2 [m/z 4452; Δm/z = 12; blue, dashed line (G)], plaques are detected in the cortex [(M), arrows] but not hippocampus (N). (O and P) For Scheme 3, cortical plaques showed significantly less isotope incorporation (75% less) as compared to hippocampal plaques (P). (Q to T) Single ion images verify that low-labeled (early) Aβ1-42 (m/z 4443) is detected in the cortex (Q) but not in the hippocampus (S). Conversely, no higher labeled Aβ1-42 is detected in the cortex (R) but solely detected in hippocampal deposits (T). Bar plots (B, H, and P) indicate means ± SD. n = 3 animals, N = 10 (Ctx) and N = 5 (Hipp) plaques per animal; MALDI intensity scale, 0 to 100% relative ion intensity. Scale bars, 75 μm (F, L, and T).
