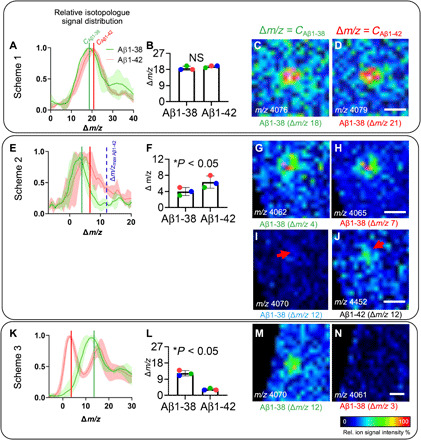
Fig. 4. Deposition of Aβ1-38 peptide occurs after Aβ1-42, as indicated by differences in 15N incorporation.

(A) MALDI-IMS spectral data of cortical plaques show relative isotopologue distributions for Aβ1-38 and Aβ1-42. Δm/z indicates the shift of isotopologue signals compared to the m/z of the monoisotopic, unlabeled peptide. Centroid values for the curves fitted to the isotopologue distributions of Aβ1-38 (green, CAβ1-38) and Aβ1-42 (red line, CAβ1-42), indicating average label incorporation. (A to D) For Scheme 1, no significant difference in average isotope incorporation in between Aβ1-38 and Aβ1-42 was observed because of overlap of the relative isotopologue curves (B). (C and D) Single ion images of Aβ1-38 (m/z 4058) + Δm/z for the different centroid values (Δm/z = CAβ1-38 and Δm/z = CAβ1-42), representing average, relative isotope incorporation observed for Aβ1-38 and Aβ1-42. No difference in ion distribution was observed for the different Aβ1-38 isotopologues at Δm/z = CAβ1-42 and CAβ1-38. (E to J) For Scheme 2, Aβ1-42 showed significantly higher label incorporation (+12) as compared to Aβ1-38 (+4) (F). (G and H) Single ion images of Aβ1-38 + Δm/z for the different centroid values show no difference in ion distribution due to broad overlap of the distribution curves (E). (I and J) Ion maps for the Aβ1-38 isotopologue at maximum label incorporation as observed for Aβ1-42 (Δm/z = 12) (E). The ion signal of maximally labeled Aβ1-42 (m/z 4458) was found to localize to plaques (J), while no signal is detected for the corresponding Aβ1-38 isotopologue (m/z 4070) (I). (K to N) In Scheme 3, Aβ1-38 showed significantly higher incorporation (+12) compared to Aβ1-42 (+3) (K and L). (M and N) Single ion images of Aβ1-38 + Δm/z for the different centroid values. For Δm/z = CAβ1-38, Aβ1-38 was found to localize to plaques (M), while no signal is detected for the Aβ1-38 isotopologue at Δm/z = CAβ1-42 (K and N). Bar plots (B and F) indicate means ± SD. n = 3 animals, N = 10 plaques per animal; MALDI intensity scale, 0 to 100% relative ion intensity. Scale bars, 30 μm (D, H, J, and N).
