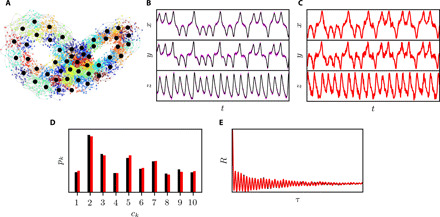
Fig. 3. CNM of the Lorenz system with 10% uniformly distributed superimposed stochastic noise.

(A) Phase-space representation of the data clustering. The centroids are depicted with black circles, and the small circles are the snapshots, colored by their cluster affiliation. The CNM accuracy is demonstrated in the accurate reproduction of (B and C) the time series, (D) the CPD, and (E) the autocorrelation function. Black, purple, and red colors denote the reference clean, the reference noisy, and CNM data, respectively.
