
Fig. 6. Rare events from the Kolmogorov flow dissipation energy.
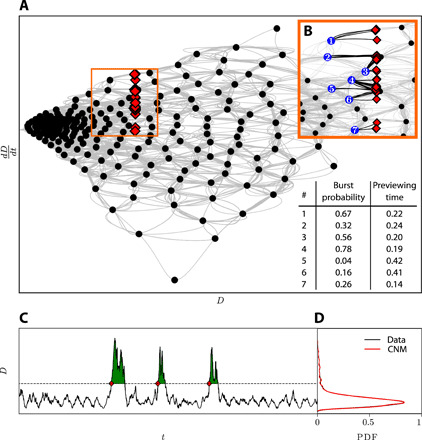
(A) The phase space spanned by the dissipation energy D and its time derivative constructed using CNM. Snapshots delimiting the onset of bursts are marked by the red diamonds and are concentrated in a specific region in the phase space. A close-up of the phase space around the red diamonds is shown in (B), where the last visited clusters preceding a burst are marked in blue. The table on the bottom right of (A) lists the corresponding burst probability and the prediction time at the seven blue centroids. A portion of the dissipation time series is presented in (C). The dashed line denotes an arbitrary threshold beyond which the peaks, represented with green filling, are considered a burst. (D) Probability distribution of the data (black) and CNM (red). Both the main peak and the decaying tail of the distribution are accurately reproduced.