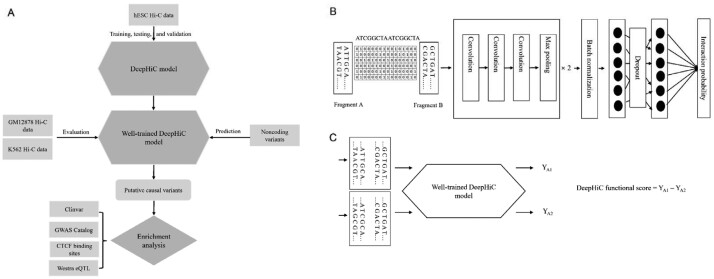
Fig. 1.
Overview of DeepHiC method. (A) The workflow of this study. (B) The overall architecture of DeepHiC. The sequences of each fragment pair were merged and converted to a one-hot matrix with 10 000 rows for 10 kb bins. The matrix can be viewed as a gray image and used as the input to feed to the CNN model. (C) DeepHiC functional score was defined as the difference between the two predicted interaction probabilities (YA1 calculated using the reference allele A1 and YA2 calculated using the other allele A2)

