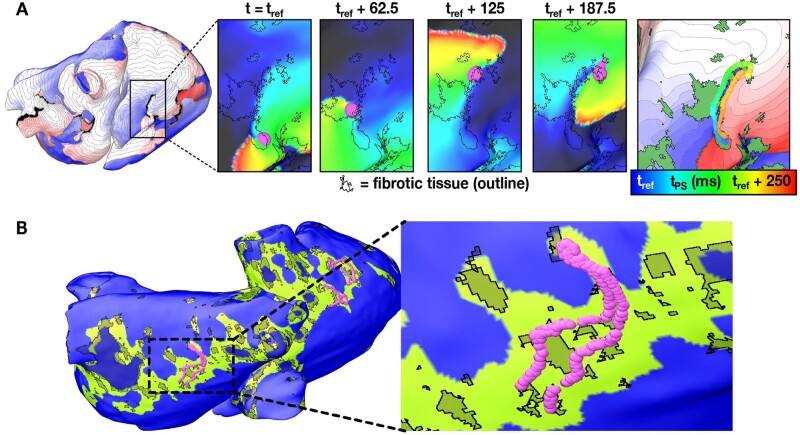
Figure 5.
Re-entrant drivers sustain AF in persistent AF patients. (A) Dynamic (i.e. time-varying) locations of the re-entrant driver organizing centre during an AF episode in a patient. An activation map (left) shows a re-entrant driver near the inferior vena cava. Inset panels show a zoomed-in view of the organizing centre (purple) at four timepoints. The fibrotic tissue boundaries are indicated by black outlines. Right-most panel shows the trajectory of the organizing centre over time superimposed on the activation map of the reentry and the fibrosis spatial pattern (green regions). (B) Location of the re-entrant driver organizing centre over time overlaid on the regions of the atria with characteristic fibrosis density and fibrosis entropy values predicted to be most likely to harbour re-entrant drivers (green). Modified with permission from Zahid et al.58

