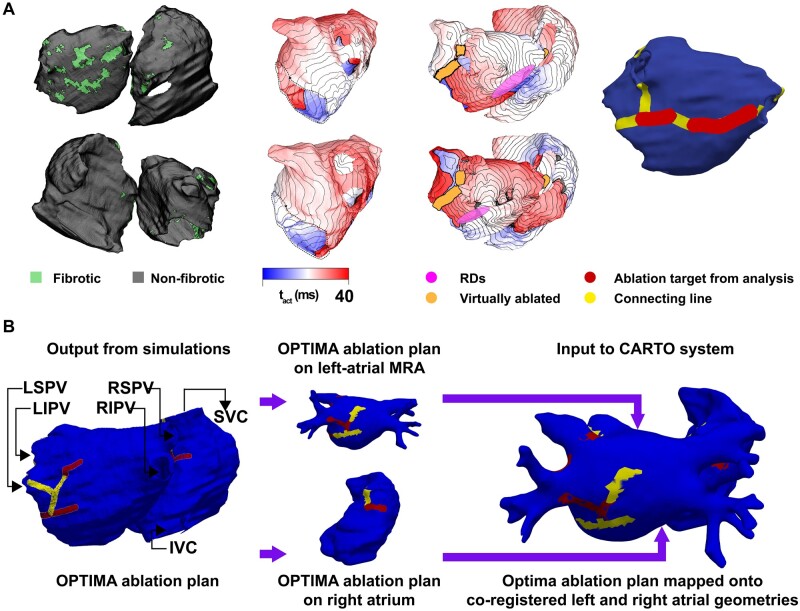
Figure 6.
Example of the process to determine the OPTIMA ablation targets in a patient with two previous failed ablations. (A) Left-most: Posterior (top) and anterior (bottom) views of the patient-specific atrial model as reconstructed from segmented LGE-MRI scans, including the distribution of fibrotic tissue. Middle-left: Two examples of AF activation sequences induced by rapid pacing, and the corresponding persistent reentrant drivers (pink). Middle-right: Two examples of activation sequences associated with arrhythmia emerging in the model following virtual ablation (lesions shown in orange), and the corresponding emergent re-entrant drivers. Right-most: Custom-tailored OPTIMA ablation treatment plan, including targets corresponding to all reentrant drivers (pre-ablation and emergent) and lesion lines connecting these target drivers to non-conductive tissue boundaries. RD, re-entrant driver. (B) Schematic summarizing the process of importing OPTIMA ablation targets into the CARTO electroanatomical navigation system. Modified with permission from Boyle et al.85

