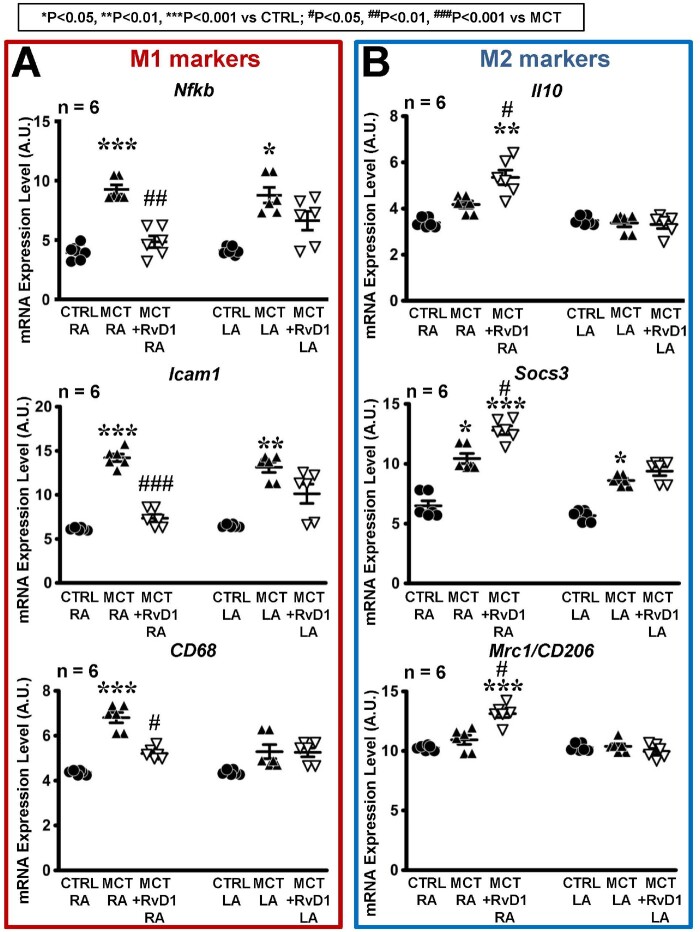
Figure 5.
Gene expression of specific macrophage markers. Gene expression level (mean ± SEM), from pangenomic transcriptome microarray analysis, expressed in arbitrary units (A.U.) for (A) proinflammatory (M1) macrophage markers: Nfkb, Icam1, CD68 and (B) anti-inflammatory (M2) macrophage markers: Il10, Socs3, Mrc1/CD206, in RA and LA. (Statistical analysis: one-way ANOVA followed by Bonferroni correction. Each point represents results from an individual animal. n = 6 rats per group.)

