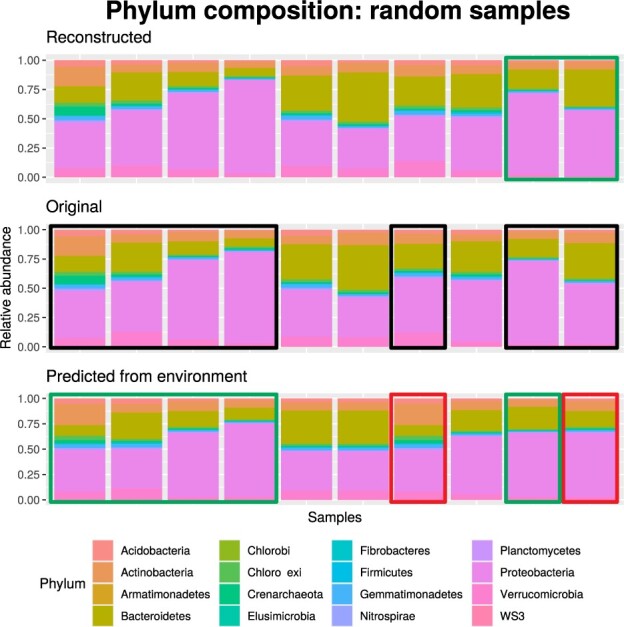
Fig. 2.

Example of reconstruction and prediction of microbial composition. In the center row is the original microbial composition, allowing it to be compared to both the reconstructed (top) and that predicted from environmental features (bottom). One sample per column. Each Phylum taxonomic category is assigned a different color. Green/red boxes highlight examples of good/bad sample reconstructions or predictions, and their corresponding original microbial composition is denoted with black boxes
