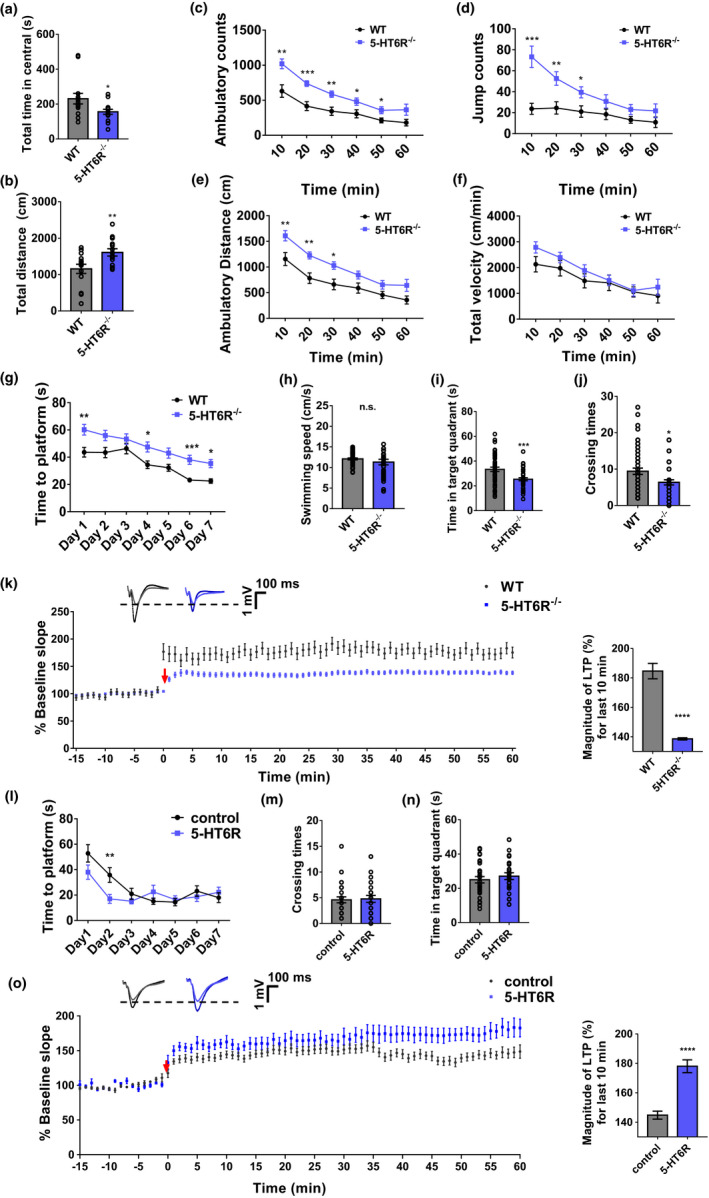
FIGURE 1.

Anxiety and cognitive impairment were induced in 5‐HT6R−/− mice. (a–b) 5‐HT6R−/− mice spent (a) less time in the central area (p = 0.0335) and (b) traveled greater distances (p = 0.0091) in the open field. (c–f) 5‐HT6R−/− mice had fewer (c) ambulatory counts (two‐way ANOVA, interaction; F 5, 130 = 2.483, p = 0.0349; time F 5, 130 = 47.36, p < 0.0001; gene, F 1, 26 = 14.99, p = 0.0007), (d) fewer jump counts (two‐way ANOVA, interaction; F 5, 130 = 6.415, p < 0.0001; time F 5, 130 = 16.92, p < 0.0001; gene, F 1, 26 = 11.05, p = 0.0026), and (e) shorter ambulatory distances (two‐way ANOVA, interaction; F 5, 130 = 1.385, p = 0.2341; time F 5, 130 = 54.26, p < 0.0001; gene, F 1, 26 = 10.3, p = 0.0035) in the open field, (f) but there was no significant difference in average velocity between the two groups during the entire experiment (two‐way ANOVA, interaction, F 5, 130 = 0.9234, p = 0.4681; time F 5, 130 = 24.05, p < 0.0001; gene, F 1, 26 = 1.248, p = 0.2742 n = 14 for each group). (g) In the Morris water maze test, the time to the platform was significantly longer for 5‐HT6R−/− mice than for WT mice (Day 1, p = 0.0072, Day 4, p = 0.0301, Day 6, p = 0.0001, Day 7, p = 0.0377; WT: n = 18, 5‐HT6R−/−: n = 14). (h–j) Though there was no significant difference between 5‐HT6R−/− mice and WT mice in (h) swimming speed (p = 0.2183; WT: n = 18, 5‐HT6R−/−: n = 14), 5‐HT6R−/− mice spent less time in the target quadrant (p = 0.0005) and had fewer crossings (p = 0.0100) in the Morris water maze. (k) LTP was significantly attenuated in 5‐HT6R−/− mice. Right: Summary graph shows the magnitude of LTP measured during the last 10 min post‐induction (51–60 min) in WT and 5‐HT6R−/− hippocampal slices (WT, 184.7% ± 1.7%; 5‐HT6R−/−, 138.6% ± 0.2%; p < 0.0001, t test). (l) In the Morris water maze test, the time to the platform decreased more quickly (Day 2, p = 0.0096) in mice treated with AAV‐CMV‐htr6‐EFS‐tag BFP than in the control group. (m, n) The number of crossings and time in the target quadrant showed no significant differences between the two groups. (o) LTP was partially rescued in the 5‐HT6R group. Right: Summary graph shows the magnitude of LTP measured during the last 10 min post‐induction (51–60 min) in hippocampal slices from the control and 5‐HT6R groups (Control, 144.8% ± 0.9%; 5‐HT6R, 178.0% ± 1.4%; p < 0.0001, t test)
