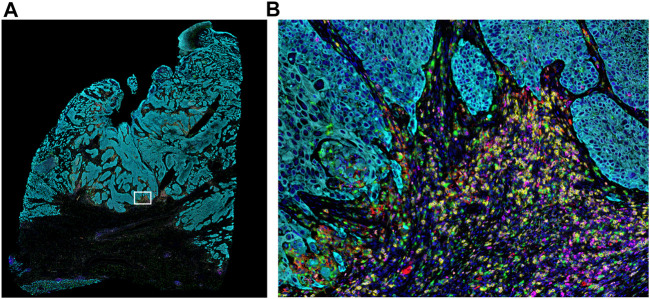
FIGURE 2.
Whole-slide MOTiF image of lung cancer FFPE tissue. (A) Markers stained for this 6-plex, 7-color assay include CD8 (yellow), PD-L1 (red), FoxP3 (orange), PD-1 (magenta), cytokeratin (cyan), and CD68 (green). White box indicates (B) selected area from whole tissue section image at 20× magnification highlighting the interactions between the immune system and the tumor (i.e., “hotspot”). The cellular composition and distribution reveal immune engagement with the tumor, evidenced by tumor-infiltrating lymphocytes (TILs), PD-L1+ macrophages, PD-L1− tumor cells, and an abundance of para-tumoral regulator T-cells and cytotoxic T-cells, including several that are PD-1+. Elucidating the interplay between these different cell types is key to understanding the variance in patient responsiveness to therapeutic treatments.

