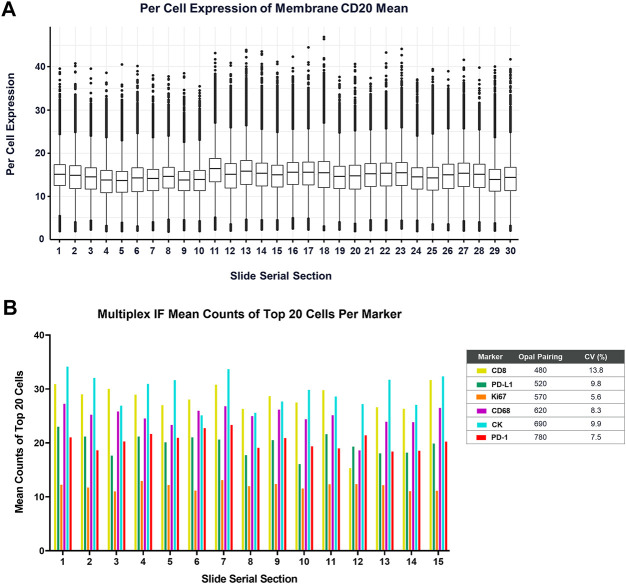
FIGURE 7.
Measurement of the BOND RX performance is captured by (A) running a CD20-Opal 520 monoplex assay across 30 serial sections. The percent coefficient of variation (%CV) is calculated by determining the mean expression of the top 20 brightest expressing cells across five matching annotations on all the serial sections. (B) Similarly, an optimized 6-plex, 7-color assay is also run on 15 serial sections, and the mean IF counts of the top 20 cells per marker are measured and the mean, standard deviation, and %CV are calculated.

