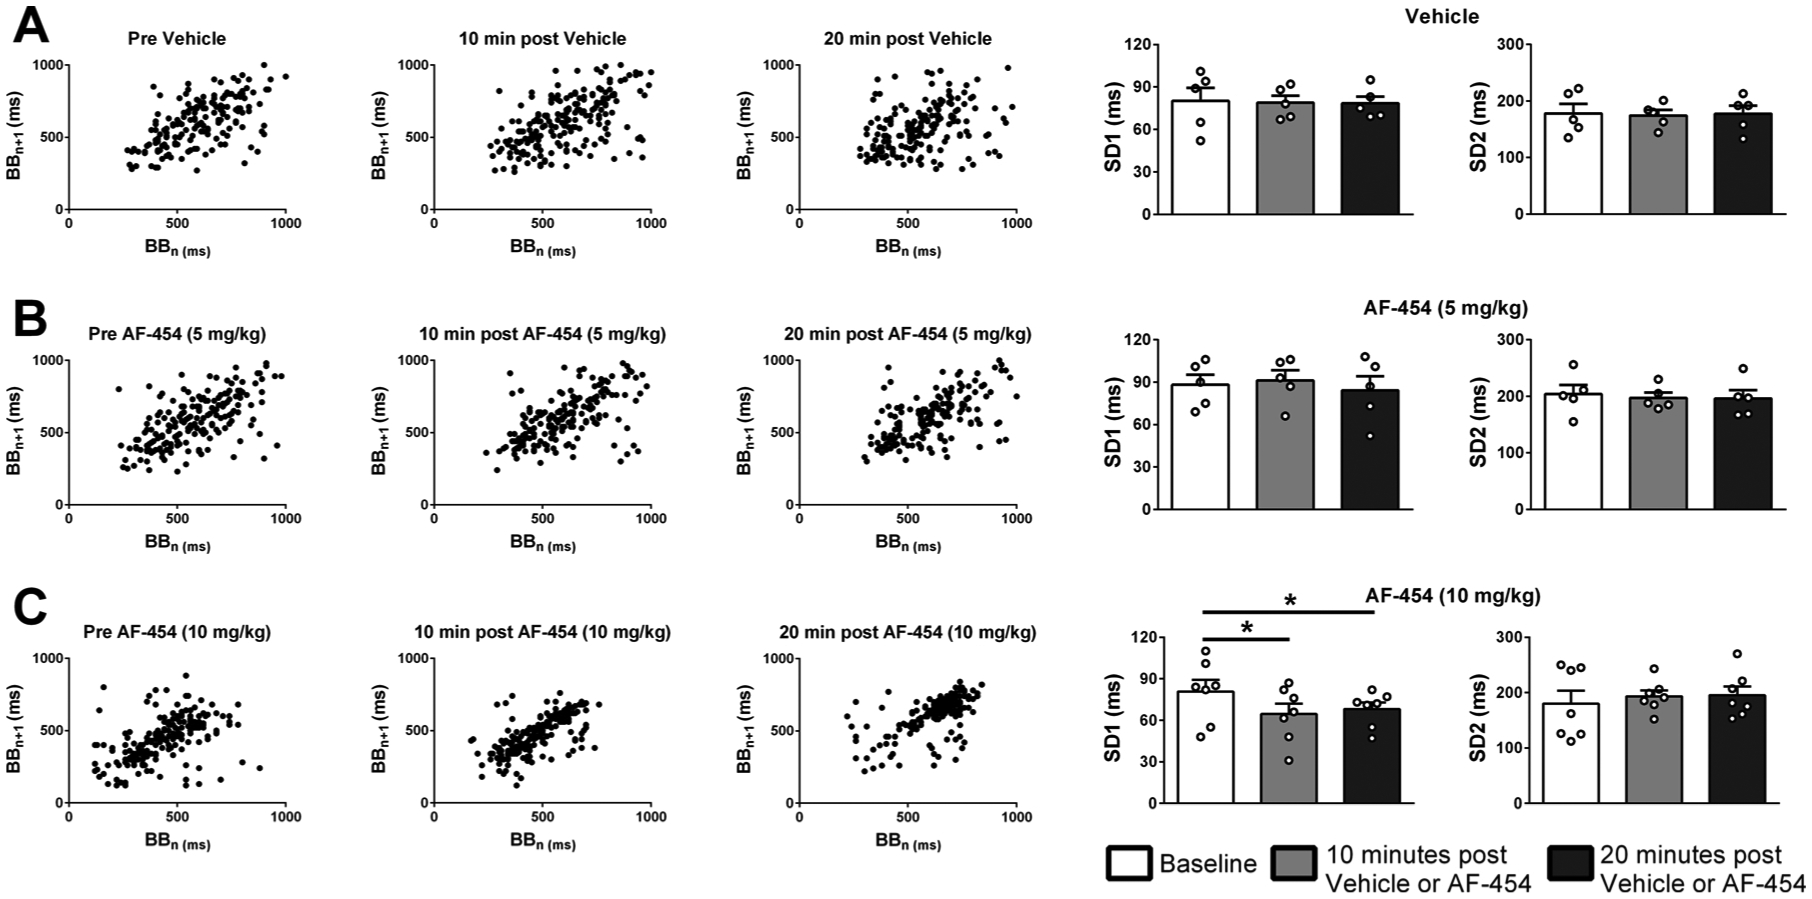
Fig. 3.

Representative Poincaré plots showing the consecutive breath-to-breath intervals and grouped data of SD1 (short term variability) and SD2 (long term variability) of breathing before, 10 and 20 min after vehicle or AF-454. A. Vehicle (n = 5), B. AF-454 (5 mg/kg, n = 5) and C. AF-454 (10 mg/kg, n = 7). Data were analysed by repeated measures one-way ANOVA with Tukey post hoc test. *P < 0.05 vs respective baseline values.
