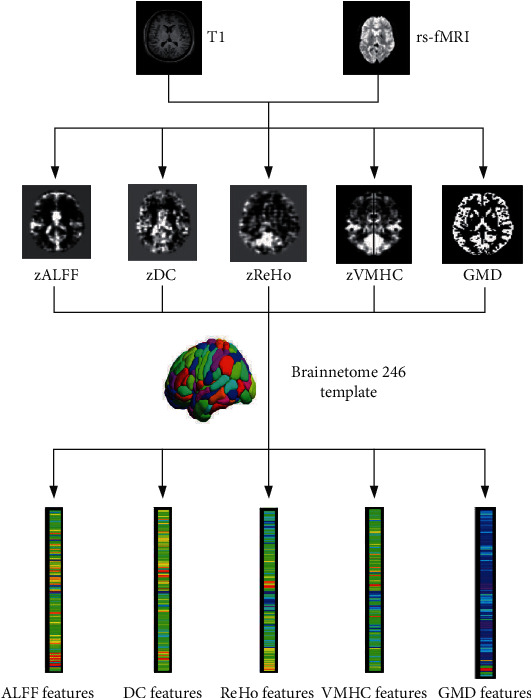
Figure 1.

The flowchart of feature extraction. The data preprocessing and index calculation of fMRI and sMRI were performed by the DPABI toolbox, and then, functional maps were then performed Fisher-Z transformation. Finally, we obtained fMRI and sMRI measurement maps, including zALFF, zDC, zReHo, zVMHC, and GMD. The fMRI and sMRI maps were segmented into 246 regions of interest using the Brainnetome 246 atlas, and then, we got 246 features for each fMRI and sMRI map. ALFF: amplitude of low-frequency fluctuations; ReHo: regional homogeneity; DC: degree centrality; VMHC: voxel-mirrored homotopic connectivity.
