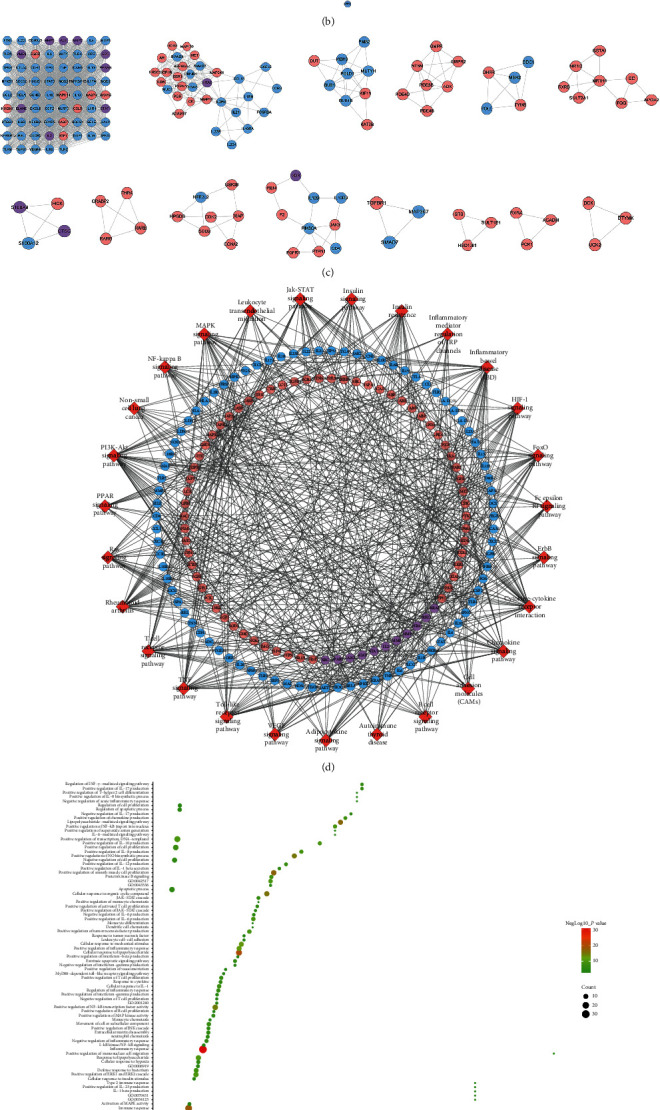
Figure 1.

Network analysis results. (a) Venn diagram of berberine's potential targets and UC genes. (b) Berberine-UC PPI network. (c) Clusters of berberine-UC PPI network. (d) Signaling pathway of berberine-UC PPI network. (e) Bubble chart of biological processes in cluster 1. (f) Bubble chart of signaling pathway. Red diamonds stand for signaling pathways; pink circles stand for berberine potential targets; blue circles stand for UC genes; purple circles stand for berberine-UC target. x-axis stands for fold enrichment.
