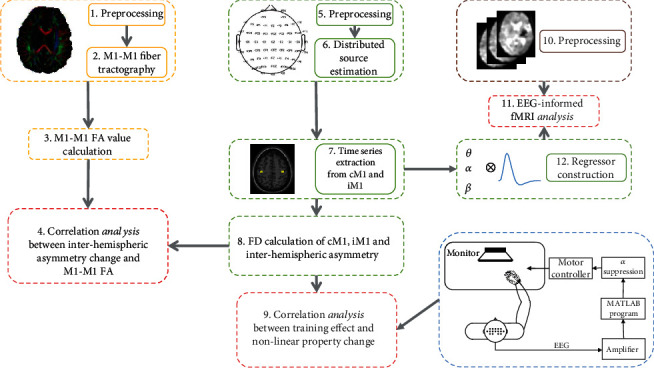
Figure 1.

Illustration of analysis pipeline. The whole analysis included processing of fMRI, EEG, and DTI data; EEG-informed fMRI analysis; correlation analysis between training effect and nonlinear property change characterized by FD; and correlation analysis between interhemispheric asymmetry change and integrity of M1-M1 anatomical connection quantified by FA.
