Figure 2.

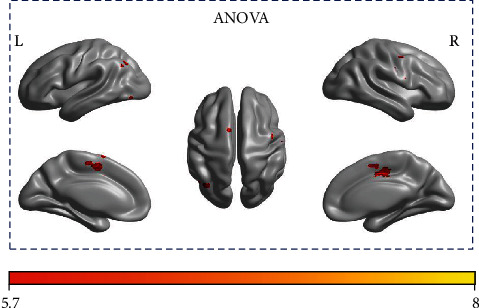
Surface rendering of brain functional regions which showed significant time × frequency interaction for iM1 regressor. The right side is the ipsilesional side.

Surface rendering of brain functional regions which showed significant time × frequency interaction for iM1 regressor. The right side is the ipsilesional side.