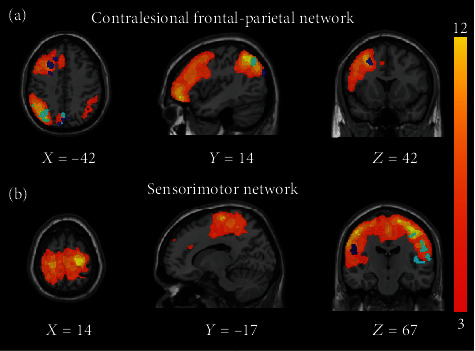
Figure 6.

The overlap with contralesional frontal-parietal network and sensorimotor network. (a) The orange color-coded areas indicated the contralesional frontal-parietal network. The azure and violet color-coded areas indicated the regions which showed significant partial correlation change for theta and alpha band EEG signals from iM1. (b) The orange color-coded areas indicated the sensorimotor network. The azure and violet color-coded areas indicated the regions which showed significant partial correlation change for theta and beta band EEG signals from iM1. The contralesional frontal-parietal network and sensorimotor network were extracted using independent component analysis (ICA), and the detailed description of the extraction process is provided in supplementary materials. The right side is the ipsilesional side.
