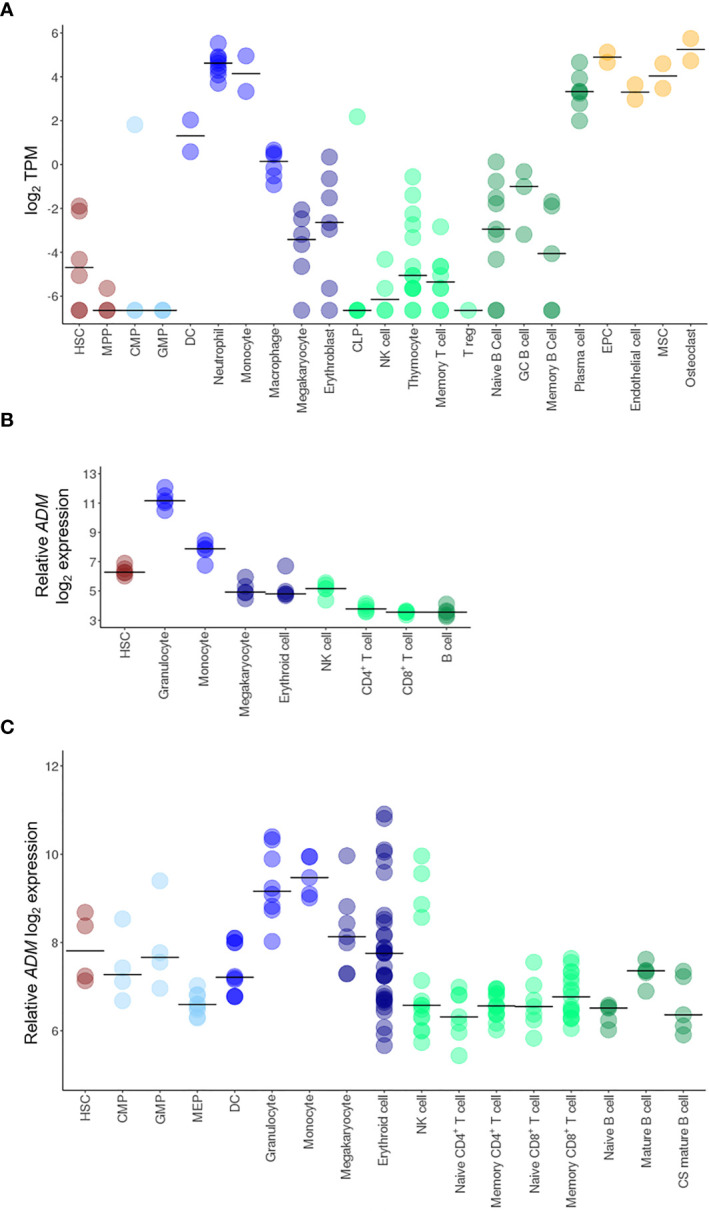
Figure 1.

ADM expression in HSC and in the hematopoietic system. Transcriptional analysis of ADM expression in hematopoietic cells from the BLUEPRINT (A), the GSE98791 (B) and the GSE24759 (C) datasets. Scatter plots were generated with the R package ggplot2 (48) (version 3.3.1). Each dot indicates one sample and the bar represents the median value (HSC, hematopoietic stem cells; MPP, hematopoietic multipotent progenitor cells; CMP, common myeloid progenitors; GMP, granulocyte–monocyte progenitors; DC, conventional dendritic cells, CLP, common lymphoid progenitors; NK, natural killer; T reg, regulatory T cells; GC, germinal center; EPC, endothelial progenitor cells; MSC, mesenchymal stem cells; MEP, megakaryocyte-erythroid progenitors; CS, class-switched; TPM, Transcripts Per Million).
