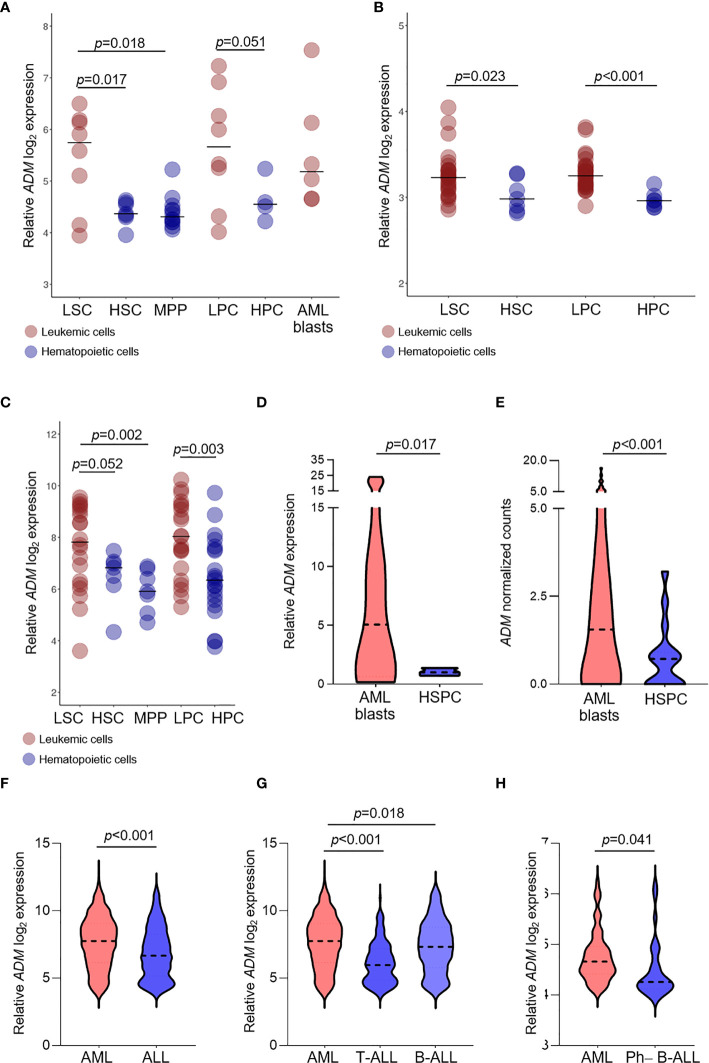
Figure 2.
ADM expression is elevated in leukemic compared with hematopoietic stem and progenitor cells and in AML compared with ALL. (A–C) Comparison of ADM levels between leukemic cells subpopulations and normal stem and progenitor cells in the GSE24006 (A), the GSE117090 (B) and the GSE63270 (C) datasets. Subpopulations according to their surface phenotype: leukemia stem cells (LSC): (Lin−)CD34+CD38−(CD90−), hematopoietic stem cells (HSC): Lin−CD34+CD38−CD90+(CD45RA+/−), hematopoietic multipotent progenitor cells (MPP): Lin−CD34+CD38−CD90−CD45RA−, leukemia progenitor cells (LPC): (Lin−)CD34+CD38+(CD90−), hematopoietic progenitor cells (HPC): Lin−CD34+CD38+(CD90+), AML blasts: Lin−CD34−. Scatter plots were generated with the R package ggplot2 (48) (version 3.3.1). Each dot indicates one sample and the bar represents the median value. (D) Comparison of ADM levels between AML blasts (n = 12) and healthy CD34+ bone marrow cells (n = 3, hematopoietic stem-progenitor cells, HSPC, qRT-PCR) and (E) between AML blasts (n = 60) and healthy G-CSF mobilized HSPC (n = 16) from the GSE158596 dataset. (F) ADM transcript levels in AML (n = 505) and ALL (n = 784, GSE13159), (G) separated in T-ALL (n = 173) and B-ALL (n = 441) and (H) in AML (n = 61) versus Ph−B-ALL (n = 29, NGS-PTL). Violin plots were generated with GraphPad Prims (version 8.4.3). The plots represent the frequency distribution of ADM levels (from minimum to maximum) and the dotted line indicates the median value.

